Uniflow is an advanced visual workflow automation, protocol ingestion, and rule-evaluation platform. Built specifically for industrial IoT, physical security integration, and telemetry processing, Uniflow bridges diverse communication protocols (Modbus, OPC UA, MQTT, SNMP, BACnet, HTTP, Avigilon, Milestone, Hexagon Lidar, CAN Bus, and SIA) with a powerful, deterministic visual rule engine. The application provides seamless real-time data ingestion, transformation, decision execution, local in-memory storage, and live diagnostic monitoring.
1.2 Target Audience
Operations Engineers & System Integrators: Users who design and configure automated data pipelines, map industrial sensors, and build complex logic graphs without writing raw code.
System Administrators: Professionals responsible for deployment, protocol security, diagnostic logging, and machine licensing across enterprise infrastructure.
Technicians & Maintenance Personnel: Support staff utilizing live telemetry views, real-time execution logs, and adapter helper tools to troubleshoot field devices and communication faults.
1.3 System Requirements
Operating System: Windows 10/11 (64-bit) or Windows Server 2019/2022.
Network Interface: Dedicated NIC(s) reachable by field devices (TCP/UDP, serial COM ports for hardware adapters).
2. Getting Started
2.1 Installation and Setup
Uniflow is deployed as an integrated desktop control environment and background service suite.
Unpacking / Execution: Run the Uniflow desktop executable. The system initializes local IPC (Inter-Process Communication) to communicate with the underlying Uniflow background processing service.
Initial Verification: Upon launch, check the top-right corner of the interface across any page to verify active subsystem connection badges (e.g., *System Storage Connected*, *Local Catalog Sync Active*).
2.2 Quick Start Workflow
To verify operational readiness immediately after setup, follow this end-to-end onboarding and automation sequence:
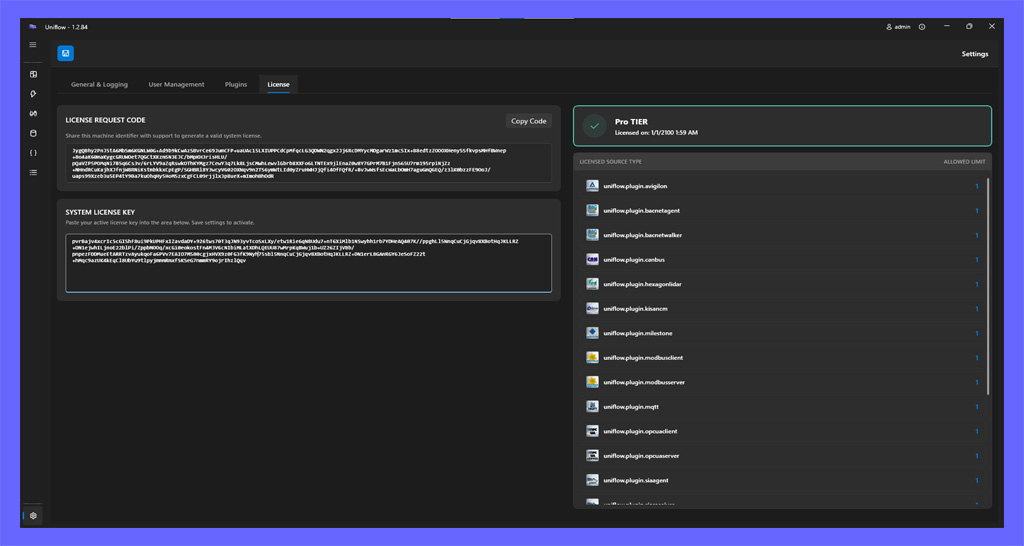
Generate License Request: Navigate to the Settings page via the sidebar navigation and select the System License Management tab. Click Copy Code to capture your generated License Request Code and submit it to your support representative for registration.
Input System License: Upon receiving your issued license key string, paste it into the System License Key input field and click Save Settings in the toolbar.
Verify License Status: Observe the dynamic Status Badge Card update to LICENSED SYSTEM (teal/green badge). Check the Allowed Capacity Limits Table to verify your permitted source adapters and allowed instance counts.
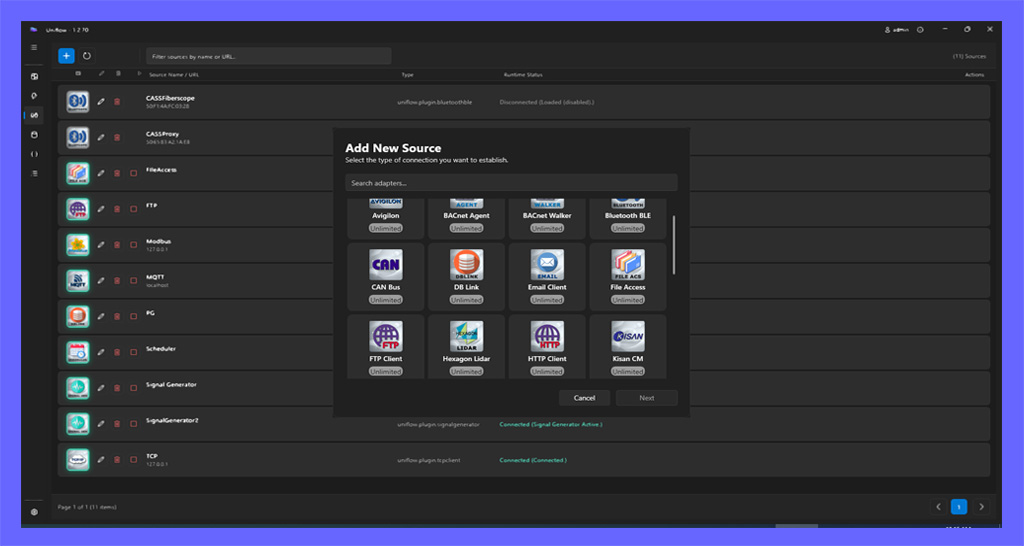
Add Source: Navigate to the Sources page via the sidebar, click Add Source, select a source adapter (e.g., *Modbus TCP*), and configure its connection parameters.
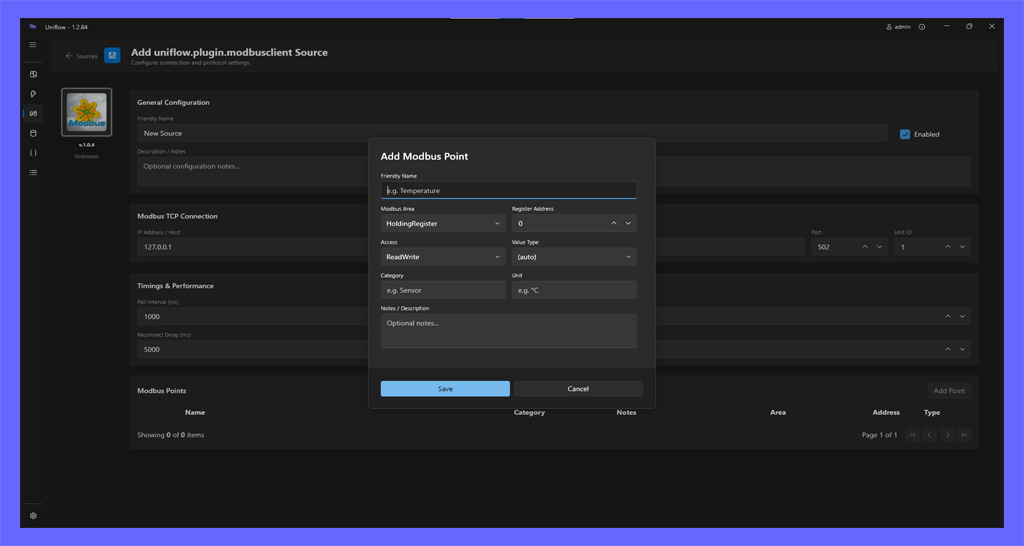
Add Points to Source: Within the source configuration panel, add specific Data Points (e.g., holding registers) to sample, then click Save and start the source.
Add a New Rule: Navigate to the Rules page and click Add Rule to open the blank canvas.
Fill Identification Fields: In the rule settings panel, fill in the mandatory identification fields: Name, Group, Priority, and verify Enabled is checked.
Add Graph Nodes: From the Sources In/Out toolbox on the left, drag an Input Source node and an Output Target node onto your canvas.
Bind Source to Input Source: Select the Input Source node, click Configure Input... in its property panel, and bind it to the Data Point created in Step 5.
Bind Target to Output Target: Select the Output Target node, click Configure Target..., and bind its destination. Wire the output port of the Input Source across to the Value input port of the Output Target node.
Save the Rule: Click Save in the top toolbar. Verify that the compilation badge turns green and displays "Compiled".
Preview Execution: Click the Preview button to launch the live runtime window and monitor live data evaluating through your graph in real time.
2.3 Navigation and Interface Architecture
The Uniflow application interface is structured around a modern Fluent UI Navigation Sidebar on the left, providing rapid access to the seven core functional workspaces:
Dashboard: A central operational monitoring and telemetry diagnostic workspace featuring integrated views: the Topology View with an executive System Health Score (0–100%) and visual mapping of active data pipelines with node/source detail drawers, the Alerts Panel for real-time notification tracking and management, the Gauges Dashboard for customizable HMI telemetry visualization, Sources Traffic Telemetry & History for live adapter bandwidth, round-trip response time (RTT), polling cadence/jitter, connection flapping counters, and persistent 90-day time-series historical analytics with CSV export, Rule Execution Telemetry & Latency Profiling for real-time execution duration profiling, SLA indicators, and hotspot analysis, Deep Infrastructure & System Health for ThreadPool, GC generational memory, and host disk capacity monitoring, and Security, Sessions & Audit Governance for active client session auditing and IP lockout ban management.
Rules: A design surface for building, compiling, and deploying visual automation graphs that process data and trigger actions.
Sources: A collection of configurable data adapters that connect to and ingest data from diverse systems, hardware devices, and network protocols.
Storage: A structured repository for managing persistent data points and monitoring live system telemetry. It enables flexible storage configuration, memory point management, and real-time data inspection for both individual variables and complex objects.
JSON Objects: A collection of user-defined JSON structures that act as flexible templates for shaping, organizing, and validating complex data payloads. These structures are used to parse raw data, maintain state for complex object types, and ensure consistent data formatting across the application.
Logs: A comprehensive, time-ordered record of all system activities, errors, and data processing events. It supports filtering, real-time inspection, and analysis to aid in monitoring and troubleshooting.
Settings: System-level configuration and administrative controls for managing logging verbosity, recursion protection, email alert notifications, user accounts, and machine licensing.
3. Core Features: Navigation Views In-Depth
3.1 Dashboard
The Dashboard serves as the central operational monitor. It houses an integrated sub-navigation bar allowing operators to switch seamlessly between three core monitoring workspaces: the Topology View, the Alerts Management Panel, and the Gauges Dashboard.
3.1.1 Two-Tier Topology Navigation
The visual topology engine operates across two distinct hierarchical display levels:
Level 1: System Overview: Upon initial load, the canvas renders the macro-level architecture, displaying active Source Adapters and high-level logical Rule Groups. This provides an immediate, uncluttered view of enterprise ingestion pipelines.
Level 2: Rule Group Deep-Dive: Double-clicking any Rule Group node zooms inside that specific subsystem, dynamically transitioning the canvas to display all individual Rule Graphs executing within that group. A dedicated ← Back to Overview button in the upper-left corner returns the viewport to the macro view.
3.1.2 Interactive Canvas & Controls
The dashboard canvas provides extensive spatial and animation customization options:
Arranging Sources (Persistent Layouts): Engineers can freely click and drag nodes across the D3 physics simulation canvas to arrange sources and groups according to physical plant layouts or architectural preferences. Node coordinates are automatically saved and persisted across application restarts.
Activity Toggle: An interactive toggle switch (Activity) enables or disables live visual telemetry animation pulses (glowing data bubbles) traveling along connection links whenever data frames pass between nodes.
Animation Speed Slider: A dedicated range slider (Speed) dynamically adjusts the transit velocity of telemetry pulses (adjustable from 500ms up to 5000ms), allowing operators to balance visual feedback against system busyness.
Fit View Button: Clicking the Fit button (⛶ Fit) instantly rescales and centers the D3 zoom transformation to frame all active nodes perfectly within the visible screen window.
Minimap Navigation: A picture-in-picture minimap in the lower corner tracks global node positions and renders an interactive bounding box representing the current viewport, allowing rapid panning across expansive topologies.
3.1.3 Node Properties, Source Details Side Panel & Diagnostics
Selecting any node on the canvas reveals contextual diagnostics:
Source Details Side Panel: Clicking on a Source Adapter node opens the right-side sliding panel featuring:
Connection State & Error Reporting: Real-time status dot indicator, status description, and detailed exception message box if faulted.
Connection Flapping & 24h Availability:
24h Availability Percentage: Continuous uptime calculation over a rolling 24-hour window (color-coded: Green >=99%, Amber >=95%, Red <95%).
Reconnect Transitions Counter: Displays total disconnect/reconnect transitions within the last 1 hour and last 24 hours (e.g., 0 (1h) / 2 (24h)).
Flap-Rate Warning Alert: Flashing alert banner triggered when reconnection transitions exceed 3 events per hour, warning operators of unstable network links or serial bus timeout cycles.
Polling Cycle Time & Jitter: For polling protocol adapters (Modbus, OPC UA, SNMP):
Configured Poll Rate: Target polling frequency configured in adapter settings (e.g., 100 ms).
Measured Duration: Actual physical round-trip scan time measured across devices (e.g., 210 ms).
Poll Jitter: Standard deviation variance in milliseconds (e.g., ±14.2 ms), exposing slow serial bus responses or network congestion.
Endpoint Details: Displays host address, IP, port number, and operator notes.
Connected Rules Summary: Badge count and list of all rule graphs currently bound to this source.
Node Details Bottom Panel:
Execution Metadata: Displays operational health badges, connection state, and live activity metrics.
Historical Scatterplot: Renders a time-series scatterplot tracking recent telemetry values, execution latencies, or evaluation states over time.
Graph Filtering: Granular filtering controls including Inputs / Outputs toggle buttons, Live / Pause Stream freezing, and metric series isolation.
3.1.3.1 Visual Connection Status, Health Glows & Impairment Propagation
The dashboard provides immediate visual feedback across the topology canvas to reflect physical connection states and their impact on rule pipelines:
Source Node States & Pulse Effects:
Connected (Normal): The source adapter is communicating normally. The node outline is neutral/slate (#455674) with no alert rings. Uptime accumulates normally.
Connecting / Reconnecting (Orange Warning Glow): The source adapter is actively attempting to establish connection. It is offline and cannot yet transfer data. The node renders an orange pulsing glow (#ffae42, .status-warning) and emits a radiating orange ripple ring (.source-alert-ring.ring-warning).
Disconnected / Faulted (Red Error Glow): The source adapter is disconnected, timed out, or in an unrecoverable driver fault. The node renders an emergency red pulsing glow (#ff4d4d, .status-disconnected) and emits an alert ripple ring.
Impairment Propagation to Connected Rules & Groups:
Critical Dependency Tracking: If any primary input, event input, or data source required by a rule is not connected, the rule cannot process incoming telemetry.
Disconnected Source State: While a source is Disconnected or Faulted, all rules and macro groups bound to that source display a prominent Red Glow (.health-error) and show an error badge (⚠ N Rules).
Reconnecting Source State: When the source begins reconnecting (Connecting), it changes to an orange glow. Connected rules and rule groups also transition to a visible Orange Warning Glow (.health-warning), displaying warning badges (⚠ N Rules) and contextual tooltips (e.g., Primary input 'Modbus_PLC' is Connecting).
Recovery: Groups and rules remain marked with their respective glow until all upstream and downstream sources are fully Connected (online). Only then do the rules and groups extinguish their glow and return to the normal resting state.
Uptime & Downtime Accounting:
Initial Startup & Warm-Up: When the service starts or an adapter is initialized, the source enters a warming-up phase (Connecting). Downtime is never counted before a source has been online. The warm-up period maintains a clean baseline of 100% uptime with 0s connected duration and 0 reconnects.
Outage-Based Downtime: Downtime is counted only if the source was online (Connected) before. The instant an established connection drops away from Connected (entering Disconnected, Connecting, or Faulted), downtime begins accumulating and only stops when Connected state is restored.
Reconnection Tracking: The initial connection is never treated as a reconnect. Reconnection and flapping counters only increment when a source successfully recovers from an outage after having previously been online.
3.1.4 Operational Summary Indicator & System Health Score
A persistent status bar at the top of the dashboard displays aggregate operational metrics, including the System Health Score, service uptime, host CPU/RAM utilization, active source adapter counts, and running vs. disabled rule totals.
3.1.4.1 System Health Score (0–100%)
Positioned prominently at the front of the summary indicator, the System Health Score provides an executive, real-time index of overall operational integrity. The score dynamically updates across heartbeats, connection transitions, and rule execution events.
• Host CPU >90% or Service CPU >80%: -5% • Host RAM Utilization >90%: -10%
Monitors host machine saturation, memory pressure, and resource starvation.
3.1.4.3 How to Read the System Health Score
≥ 95% (Emerald #10b981 — Optimal): All subsystems operating nominally. All enabled source adapters are connected, rules evaluate without drops or compilation faults, and no unacknowledged warning/critical alerts exist.
80% - 94% (Green #22c55e — Good): Normal operational state with minor non-blocking issues (e.g. an informational alert or an isolated reconnection event).
65% - 79% (Amber #f59e0b — Degraded): Operational degradation detected. Requires operator review. Typically caused by an unacknowledged warning alert, an offline non-critical source, connection flapping, or high host CPU load.
< 65% (Red #ef4444 — Critical): Severe operational hazard requiring immediate intervention. Caused by unacknowledged critical alarms, multiple offline sources, faulted rule logic, or severe memory exhaustion.
Clicking the score widget allows operators to quickly identify degraded subsystems and navigate to the corresponding diagnostic tabs.
3.1.5 Real-Time Alerts Management Panel
The Alerts Panel provides an in-memory alert tracking and management system for monitoring system-wide exceptions, protocol driver faults, connection state transitions, and custom rule-generated alerts.
Unread Alert Counter & Sidebar Badging: Real-time counter displaying active unread alerts, synchronized across the main navigation sidebar badge and upper status bar.
Interactive Alerts Data Grid: Formatted table listing active and historical alerts, featuring:
Severity Badges: Visual indicators categorizing entries by severity level (Critical in Red, Warning in Amber, Info in Blue).
Message Body: Monospaced wrapping text block detailing the specific fault, exception, or recovery state.
Batch Operations: Supports individual row selection, single-click acknowledgement, bulk Acknowledge All, and Clear All confirmation modal dialogs.
Source Endpoint Drawer: Selecting an alert associated with a specific data source opens a right-side detail drawer displaying live connection status, host/port network properties, and connected rule graph bindings.
Automated SMTP Dispatch Integration: Generated alerts automatically trigger outbound HTML email notifications to configured operator email lists when SMTP alert dispatching is enabled in Settings.
3.1.6 Interactive Gauges Dashboard
The Gauges Dashboard is a real-time visual telemetry canvas allowing operators to create, layout, and monitor custom HMI dashboard gauges.
Multi-Cell Grid Architecture: Built on a high-density 2D layout grid supporting drag-and-drop card placement, collision detection, and automated grid snapping.
Multi-Cell Width Spanning (ColSpan): Cards support customizable column spanning (ColSpan: 1..4), allowing wide multi-cell time-series charts or compact single-cell digital displays.
Gauge Display Types:
Radial / Circular Gauge: Classic analog dial featuring dynamic needle rotation, min/max range boundaries, and color-coded threshold arcs.
Linear Progress Bar: Horizontal/vertical level bar for capacity, percentage, and tank level visualization.
Digital Numeric Display: High-contrast digital readout displaying current scalar telemetry values paired with engineering unit strings (e.g. °C, bar, RPM).
Infinite Graph Gauge: Time-series trend chart featuring auto-scaling Y-axis boundaries, userSpaceOnUse linear gradient fill for green/red threshold coloration, interactive millisecond-accurate hover tooltips, and real-time streaming data updates.
Gauge Configuration Modal: Modal dialog for adding and editing gauge cards, defining bound data point keys, engineering unit labels, range limits, warning thresholds, and grid span settings. Grid coordinates and card settings are automatically persisted to local storage across system restarts.
The Sources Traffic Telemetry view delivers an interactive operational telemetry and bandwidth diagnostics grid across all active source adapters. Each source card is organized into five structured columns:
To maximize readability and prevent horizontal text overflow into adjacent summary boxes, the Source Info column utilizes a dedicated two-line telemetry layout:
Line 1 (Top — Availability & Uptime):
Displays rolling availability percentage over the last 24 hours and total continuous connection duration (e.g. 99.8% (2d 4h 12m) uptime).
Color Coding:
Green (#10b981): ≥ 99.0% availability (reliable field connection).
Red (#ef4444): < 95.0% availability (unacceptable downtime).
Line 2 (Bottom — Reconnections & Last Disconnect Tracker):
Displays total reconnections in the last 24 hours paired with a human-readable relative timestamp indicating when the most recent disconnection occurred:
0 reconnects today (flawless stability).
2 reconnects today (last 14m ago) (active connection with past drop).
What is Connection Flapping?: Field wiring faults, serial transceiver collisions, marginal Wi-Fi/cellular signals, or aggressive device sleep cycles frequently cause an adapter to repeatedly disconnect and reconnect in rapid cycles. Unlike a permanent failure, flapping causes intermittent telemetry blackouts and floods event logs.
Flapping Threshold: The engine flags a source as Flapping whenever reconnection transitions exceed 3 events per hour (>3reconnects/h).
Pulsing Square Glow Outline (No Layout Shift):
Rather than rendering a bulky text badge that forces content onto a secondary row and stretches row heights, the reconnection row dynamically transitions to an active pulsing crimson square glow outline (.source-reconnects-row.has-flap-warning).
An inline warning indicator (⚠️) highlights the reconnect text in crimson (#fca5a5), retaining identical line height and 0px layout shift.
Interactive Tooltip: Hovering over the flapping outline displays complete diagnostic history:
TEXT
⚠️ Connection Flapping: 4 reconnects in last 1h (>3/h threshold) | Total today: 4
3.1.7.3 Round-Trip Response Time (RTT) in App Totals
Located in Column 2 (APP TOTALS), the RTT metric measures live protocol round-trip transaction latency in milliseconds:
Direct I/O Stopwatch Sampling: The engine measures round-trip duration using high-resolution hardware timers (System.Diagnostics.Stopwatch) that wrap every communication dispatch to the adapter:
Cyclic tag refresh sweeps (RefreshValuesAsync).
On-demand point reads (ReadAsync).
Direct control writes (WriteAsync).
Action and command dispatches (ExecuteAsync).
Outlier Filtering: Samples ≤ 0ms or > 60,000ms (long timeouts) are discarded to protect averages from corrupt or disconnected outliers.
Rolling Average RTT (<avg>ms): Calculated using an Exponential Moving Average (EMA) with an 80/20 smoothing weighting:
AvgRTTnew= (AvgRTTold× 0.8) + (Samplelatest× 0.2)
This provides a responsive, jitter-resistant baseline that reflects sustained latency shifts without overreacting to single-packet anomalies.
95th Percentile Peak RTT ((p95: <p95>ms)): Computed over a continuous 5-minute rolling window:
All valid RTT samples recorded within the last 5 minutes are maintained in an in-memory sliding buffer (samples older than 5 minutes are automatically purged).
The buffered samples are sorted in ascending order.
The 95th percentile index is calculated as Index= \lceil N × 0.95 ⌉ - 1.
Operational Value: Tail latency is critical in industrial automation. A device might average 9ms, but a 95th percentile of 150ms reveals intermittent bus collisions, packet retries, or device CPU contention that could stall real-time control rules.
Hover Tooltip: Hovering over the stat displays exact unrounded values: Average: 9ms | 95th Percentile: 63ms.
Latency Benchmarks:
< 20ms (p95 < 50ms): Optimal local Ethernet (Modbus TCP, OPC UA) or high-speed serial bus (115,200 baud).
20 - 80ms (p95 < 150ms): Typical switched plant network or standard serial bus (9,600 baud).
80 - 250ms (p95 < 500ms): Wireless industrial Wi-Fi, cellular IoT gateways, or remote WAN tunnels.
> 500ms: Degraded link; indicates severe packet retransmission, device processing backlog, or physical interference.
3.1.7.4 Polling Cadence, Jitter & Polling Lag in Plugin Totals
Located in Column 5 (PLUGIN TOTALS), the bottom metric tracks ingestion mode, physical cycle timing, and clock stability:
Mode vs. Poll Field Meaning:
Periodic Polled Sources (Poll:): Displayed for request-response protocols (Modbus Client, OPC UA Client, SNMP, BACnet) where the Uniflow adapter cyclically queries the field device. Shows measured interval and jitter: Poll: 104ms (±6ms).
Event-Driven Push Sources (Mode: ⚡ Push): Displayed for asynchronous streaming protocols (MQTT, Webhooks, WebSocket, SIA Receiver, Avigilon Event Stream) where external devices push data to Uniflow on state change. No polling interval applies.
How Polling Cadence and Jitter are Calculated:
Scan-to-Scan Timestamping: Every time an adapter completes a scan and publishes a values snapshot (ValuesChanged), the engine captures the completion timestamp tcompleted.
Cycle Duration Measurement: The elapsed wall-clock time between consecutive scan completions is measured:
Δ tcycle= tcompleted- tprevious\_completed
*(Valid range: 0 < Δ tcycle< 60,000ms)*.
Rolling Polling Cadence: The displayed scan cadence is smoothed using an 80/20 Exponential Moving Average (EMA):
Operational Remediation: If an adapter configured for 100ms takes 215ms to complete each scan, the device hardware or serial bus cannot keep up with the query rate. Technicians should increase the configured poll interval in Source Settings (e.g., to 250ms) or reduce the number of registers requested per scan packet.
Application vs. Plugin Sparklines: Column 3 tracks sanitized application-level data ingested into the rule engine, while Column 4 tracks raw socket/serial I/O exchanged over the wire (including protocol headers and cyclic heartbeats).
30-Second Service-Side Rate Buffers: The service engine maintains rolling historical rate buffers (30 1-second samples) for application and plugin inbound/outbound throughput. Telemetry polling runs continuously in the background starting from GUI launch/login. When navigating to the Sources Traffic Telemetry view, sparklines render pre-populated with historical throughput immediately, eliminating empty graph starts or initial lag.
Persistent Display Order: Operators can drag source cards by the grip handle (⠿) to prioritize critical pipelines at the top of the grid; custom ordering is automatically persisted.
The Sources Traffic Telemetry view includes a Reset Metrics button located in the top-left view controls panel:
Purpose: Allows engineers and system administrators to clear historical counters after replacing hardware, resolving wiring faults, or reconfiguring polling schedules, starting metrics tracking from a clean slate.
Confirmation Safety Dialog:
Clicking Reset Metrics opens a safety confirmation modal dialog displaying the warning:
NOTE
*"Are you sure you want to reset all sources traffic and health metrics? This will clear bandwidth counters, uptime history, reconnection events, and RTT/jitter samples across all sources."*
Cancel: Closes the dialog with zero state change.
Yes, Reset All: Dispatches the ResetSourceTraffic IPC command to the service engine.
Metrics Reset Scope:
Bandwidth & Rates: Resets application and plugin cumulative bytes (Rx/Tx) and zeroes out real-time sliding rate buckets.
Uptime & Availability: Resets the tracking baseline to the moment of reset. Sources currently Connected start fresh at 100.0% availability with 0 downtime. Sources currently Disconnected or Connecting begin tracking downtime from the reset timestamp.
Reconnection & Flapping: Clears 1-hour and 24-hour reconnection transition counters, extinguishing any active connection flapping warnings.
RTT & Jitter: Clears historical round-trip latency samples, rolling averages, peak p95 metrics, and measured polling jitter history.
3.1.7.7 Sources Telemetry History & Time-Series Analytics
The Sources Telemetry History view extends live operational monitoring with long-term, persistent time-series analytics, historical bandwidth audits, and trend diagnostics across all configured source adapters. Operators can transition seamlessly between live real-time metrics and historical archives using the History toggle button located in the top-left view controls panel.
Two-Way View Navigation:
Switching to History: Clicking the History button (📊 History) dynamically transitions the live grid into the historical analytics subview, preserving active pane geometry across fullscreen, vertical, and horizontal split-screen dashboard layouts.
Back to Live: A dedicated Back to Live button (← Back to Live) restores the real-time operational telemetry grid without reinitializing dashboard state or incurring page reloads.
Dynamic Baseline & Filter Subtitle:
Positioned directly below the view header, the interactive subtitle tracks the exact UTC baseline when historical telemetry collection started or was last cleared:
TEXT
Baseline: Since 12/09/2026 14:30 • Aggregation: Date: 2026-09-13
Dynamically updates to reflect the active aggregation filter mode, selected calendar date, or custom date range.
Historical Aggregation Modes:
Lifetime Mode: Aggregates all recorded data points across the active 90-day retention window into daily summary checkpoints. Provides a macro-level overview of sustained data throughput and protocol traffic volume over weeks and months.
Date Mode (24-Hour Single-Day Deep Dive):
Selects an individual calendar day using the inline dark-themed date picker (defaults to Today).
Segments daily traffic into 24 discrete hourly checkpoints (00:00 to 23:00 UTC).
Allows technicians to pinpoint peak communication spikes, overnight polling patterns, or abnormal transfer surges during specific operational shifts.
Date Range Mode (Multi-Day Custom Interval):
Enables custom interval analysis defined by Start Date and End Date selectors.
Computes daily aggregated traffic volumes across the selected window, ideal for monthly audits, billing reconciliation, and network capacity planning.
Dual-Graph Time-Series Visualization:
Each historical source row renders an expansive, interactive dual-trend SVG visualization:
Application Throughput Graph (Cyan / Purple): Visualizes clean application-level data ingested into the rule engine (App In vs App Out).
Plugin Wire I/O Graph (Emerald / Amber): Displays raw network socket/serial data transferred over the physical medium (Plugin In vs Plugin Out), highlighting protocol framing overhead, cyclic keep-alives, and driver handshakes.
Dynamically scales the Y-axis from 0 to the peak transfer volume within the active window.
Intelligently scales isolated single-point checkpoints into visible slope ramps, ensuring single-hour delta bursts remain clearly discernible rather than rendering as invisible single-pixel dots.
Time-Axis Tick Formatting: Automatically formats the horizontal X-axis with intuitive interval indicators (00:00, 06:00, 12:00, 18:00 in Date mode; MM/dd in Lifetime and Date Range modes).
Synchronized Guideline: Hovering over any graph draws a crisp vertical tracking cursor that snaps to the nearest time checkpoint across both Application and Plugin curves.
Elevated Hover Tooltip:
Renders a floating, high-contrast cyber-dark tooltip anchored strictly above the cursor (z-index: 99999, overflow: visible), ensuring tooltips never clip against adjacent source rows or container borders.
Displays:
Checkpoint Time / Date: Specific hourly bucket (e.g. Hour 14:00 (14:00 - 14:59 UTC)) or daily calendar date.
App In / Out: Exact bytes transferred and human-readable engineering format (e.g. 14.2 MB (14,889,984 bytes)).
Plugin In / Out: Raw wire transfer volume.
Total Interval Volume: Combined sum transferred during that specific bucket.
Display Synchronization & Sorting Parity:
Order Parity with Live Grid: The historical grid strictly inherits the display sequence established in the live Sources Telemetry grid. Any custom drag-and-drop ordering saved via the card grip handles (⠿) is preserved when switching into the History subview.
Instant Warm Pre-Population: Upon opening, the history view immediately populates card templates using active source metadata, eliminating visual flicker or empty layout shifts while background historical aggregation completes.
RFC 4180 CSV Data Export:
An Export CSV button (📥 Export CSV) in the historical control panel enables one-click exporting of the currently filtered dataset.
Generates an RFC 4180 compliant CSV file structured with standardized reporting columns:
CSV
    Source Name,Source ID,Source Type,Period,Timestamp (UTC),App In (Bytes),App Out (Bytes),Plugin In (Bytes),Plugin Out (Bytes),App In (Formatted),App Out (Formatted),Plugin In (Formatted),Plugin Out (Formatted)
    Modbus Inverter,b5e82...c1,modbusclient,Hour 10:00,2026-09-13T10:00:00Z,5242880,1048576,6291456,1258291,5.00 MB,1.00 MB,6.00 MB,1.20 MB
Launches the native Windows File Save dialog (SaveFileDialog), allowing operators to select destination paths and filenames, with an automatic web Blob download fallback.
Automatic Lifecycle Cleanup & Dead Entry Purging:
Orphan Prevention: When an operator deletes a source instance from Uniflow (via the Sources management UI or IPC commands), the service engine automatically purges all associated telemetry history—both cumulative lifetime totals and all historical hourly checkpoint archives across all calendar days—from disk (source_traffic.json) and memory.
Strict Active Scope: Historical aggregation queries strictly enforce known active source boundaries, ensuring deleted or obsolete source instances never linger as "dead entries" in historical reports or CSV exports.
Crash-Resilient I/O & Internal Alarm Escalation:
Fault-Tolerant Persistence: All historical checkpoints and cumulative metrics are persisted to source_traffic.json using atomic temporary file staging (.tmp write followed by atomic replace) with recursive failure suppression.
In-Memory Fallback: If file I/O fails due to disk space exhaustion, external process file locking (e.g. antivirus scans), or bad sectors, the Uniflow service gracefully continues operating in-memory without service disruption or crashes.
Automatic Alarm Dispatch: Any disk write or read failure immediately registers a Critical severity alarm in the internal Alarms Service (AlertStore), alerting operators via the Alerts Dashboard and triggering outbound email notifications.
> 100ms (Red — Degraded / SLA Violation): Severe latency; indicates blocking action sinks, unoptimized scripts, or synchronous network calls.
Dropped Triggers (Backpressure Skips): Dedicated counters tracking skipped trigger events in the last 1 hour and 24 hours when rule concurrency limits are saturated.
Hotspot Analysis ("Top 5 Resource Consumers"): Automatically ranks and pins the top 5 most resource-intensive rules at the top of the workspace.
Inspect Modal Drawer:
Action Sink Latency Breakdown: Visual execution meters dissecting condition evaluation time versus individual action sink execution durations, complete with target source name badges (📤 ActionName (TargetSource)).
Failure Context Inspector: Monospaced JSON snapshot inspector capturing exact trigger input values and bound graph variables at the moment of the last runtime failure.
3.1.9 Deep Infrastructure & System Health
The Deep Infrastructure & System Health view provides comprehensive operational visibility into the underlying .NET CLR runtime and host machine resources:
ThreadPool & Asynchronous Task Concurrency:
Worker Threads: Active worker threads executing tasks versus maximum allocated thread pool capacity.
I/O Completion Ports: Asynchronous I/O completion port thread utilization handling network sockets and disk reads.
Pending Work Queue Depth: Number of queued asynchronous tasks awaiting worker thread availability. An increasing backlog indicates thread pool starvation.
Active Process Thread Count: Total operating system threads spawned by the background service.
Process Working Set & Private Bytes: Total physical RAM occupied and committed virtual memory allocated.
Managed Heap Size: Total memory dynamically allocated within the .NET garbage-collected runtime.
Generational Allocation Breakdown:
Generation 0 (Gen 0): Ephemeral, short-lived objects (e.g. temporary strings, small JSON tokens, function arguments). Collected frequently with minimal overhead.
Generation 1 (Gen 1): Buffer generation acting as a buffer between short-lived and long-lived memory.
Generation 2 (Gen 2): Long-lived objects (e.g. in-memory databases, active protocol adapters, cached rule graphs). Gen 2 collections require full heap sweeps; frequent Gen 2 collections signal memory pressure.
Large Object Heap (LOH): Dedicated heap holding objects larger than 85,000 bytes (e.g. large byte buffers, image streams, large data export arrays). LOH is not automatically compacted, making fragmentation tracking essential.
Storage & Disk Capacity:
Host Drive Capacity: Free disk space versus total capacity on the service host drive with visual health meter.
Low Disk Space Alert: Flashing critical alert triggered if available drive space drops below 10%.
Log Directory Usage: Total disk space consumed by rotating application log files.
Database Storage: SQLite database file footprint on disk.
3.1.10 Security, Sessions & Audit Governance
The Security, Sessions & Audit Governance view enforces administrative access control and runtime connection auditing:
Active Client Sessions Table:
Real-time auditing of connected client sessions across Named Pipe and SignalR HTTPS transports.
Displays Session ID, Client Protocol Type, Client IP Address, Connection Duration, Active Subscription Count (rules and gauges), and Last Active timestamp.
Blocked IP Ban List Table:
Displays client IP addresses locked out by the anti-brute force authentication security shield.
Shows failed attempt count, lockout reason, lockout timestamp, and live countdown timer until ban expiry.
Manual "Unblock" Action: Provides immediate operator override to unblock an IP address and restore access without waiting for timer expiration or restarting services.
The following reference table provides operators and maintenance technicians with a quick guide to reading dashboard telemetry indicators, identifying root causes, and executing recommended operational remediation:
Metric / Indicator
Visual Appearance
Normal State
Warning / Degraded Condition
Probable Root Cause
Recommended Operator Action
System Health Score
Emerald / Green percentage badge in header bar
≥ 95%
< 80% (Amber / Red)
Offline source, unacknowledged critical alert, connection flapping, or high host CPU.
Hover cursor over score to view multi-pillar deduction breakdown resolve active alerts or failing adapters.
Source Availability
Percentage text in Source Info Column 1
≥ 99.0% (Green)
< 95.0% (Red)
Power outage, network disconnect, or device reboot.
Verify field device power and physical network link connectivity.
Connection Flapping
Pulsing crimson square glow outline (⚠️)
Muted slate text (0 reconnects today)
Pulsing crimson outline (> 3 reconnects/h)
Loose cable, intermittent serial transceiver, duplicate IP address, or Wi-Fi interference.
Inspect physical wiring, verify terminal screw tightness, check RF signal strength, or verify IP conflict on network.
Round-Trip Response Time (RTT)
RTT: <avg>ms (p95: <p95>ms) in App Totals
Average < 20ms, p95 < 50ms
Average > 100ms or p95 > 300ms
Network buffer bloat, slow serial baud rate (e.g. 9600 baud), or device processor overload.
Check network switch latency, optimize serial baud rate (e.g. 115200 baud), or reduce polling frequency.
Optimize rule execution speed or increase rule worker concurrency settings.
ThreadPool Backlog
Pending Work Queue Depth in Deep Infra
0 - 5
> 50 persistent backlog
Thread pool starvation caused by blocking calls or slow synchronous file/network operations.
Identify long-running synchronous rules or increase system worker thread limits.
GC Gen 2 / LOH Growth
Segmented memory bar in Deep Infra
Gen 0 frequent, Gen 2 rare
Continuous rapid growth in Gen 2 or LOH
In-memory leak, unbounded array growth, or uncollected byte payloads.
Inspect rule graphs for unbounded variable accumulations or large file payload streaming.
Host Disk Space
Storage meter in Deep Infra
> 20% free
< 10% free (Flashing Red)
Accumulated application log files or large historical SQLite database files.
Purge aged log files in Settings or move database file to an auxiliary storage volume.
3.2 Rules
The Rules view is a comprehensive management interface for visual logic sets. It provides advanced sorting, filtering, and execution trace inspection.
3.2.1 Toolbar Actions
Add Rule (+): Opens the dedicated Rule Editor workspace to design a new workflow from scratch.
Refresh: Synchronizes the active list of rules with the background processing engine.
Filtering: Live search textbox for filtering rules by name, paired with dropdown filters to isolate rules belonging to specific Groups or bound to specific Input Sources.
3.2.2 Data Grid Columns
Status (Indicator Ellipse): A color-coded status circle reflecting the rule's active state. Action: Double-clicking this indicator immediately toggles the rule between *Enabled* (Active) and *Disabled* (Paused).
Preview Button: Launches a live execution trace overlay. This allows engineers to view real-time data transitions and node evaluations occurring within that rule without opening the full editor.
Edit Button: Opens the selected rule inside the visual Rule Editor.
Delete Button: Permanently removes the rule set.
Rule Name: The defined unique identifier of the rule.
Group: Logical grouping category used for organizational tagging.
Source: The primary input adapter or event trigger bound to this rule.
Priority: Execution priority level determining evaluation order during simultaneous event storms.
3.3 Sources
The Sources view manages all data ingest adapters communicating with external hardware, field devices, and network endpoints.
3.3.1 Toolbar Actions
Add Source (+): Invokes a creation dialog prompting the selection of a specific source adapter type.
Refresh: Reloads adapter status and configurations.
Search: Filters configured sources by matching names, IP addresses, or URLs.
Count Indicator: Displays total configured vs. active source metrics.
3.3.2 Data Grid Columns
Status Avatar: A protocol-specific icon encased in a dynamic, glowing rounded outline representing operational health (Green glow = Active/Healthy, Red glow = Fault/Error, Grey = Stopped).
Start / Stop Controls: Dedicated runtime control buttons (► Start / ■ Stop) allowing individual adapters to be brought online or offline independently. Includes an indeterminate progress ring during connection handshakes.
Source Name / URL: The user-defined friendly name and underlying network endpoint URI.
Type: The source adapter classification (e.g., *ModbusTcp*, *OpcUa*, *SnmpWalker*).
Runtime Status: Live operational state (e.g., *Connected*, *Listening*, *Disconnected*) paired with a sub-label displaying exact error messages if a connection fault occurs.
Helper Button: Available on applicable VMS adapters (Avigilon and Milestone) to launch a specialized exploration utility that queries and browses entity collections (such as Alarms, Cameras, Servers, and Sites) fetched directly via API.
3.4 Storage
The Storage view exposes Uniflow's internal memory space, local persistence engine, and live telemetry cache. It is divided into two primary pivot tabs.
3.4.1 Filtering Card
A unified search card allowing rapid filtering across both tabs by matching Name / Point ID or filtering by specific Value Types (e.g., *Boolean*, *Integer*, *Double*, *String*).
3.4.2 Tab 1: Storage Points
Manages the structural definitions of internal memory registers.
Actions: Edit ([E]) or Delete ([D]) storage definitions.
Name: The friendly name and unique point access key.
Value Type: The expected data structure.
Default Value: The initial starting state or baseline value assigned upon system initialization.
Max Size: Clamped capacity for string or byte array buffers.
Persistent Flag: A visual badge (*Yes* in Green / *No* in Red). When set to *Yes*, point values are automatically persisted across system reboots and power losses.
3.4.3 Adding an Internal Storage "Data Point"
To allocate a new memory variable for rule graphs or external protocol access, navigate to Tab 1: Storage Points and click the Add Storage Point (+) button in the upper toolbar. Fill out the following configuration dialog:
Name / Point ID (String): A unique identifier key used to address this memory variable within Rule Graphs or REST API queries (e.g., Facility_Target_Setpoint).
Value Type (Dropdown): Expected structural format (Boolean, Integer, Double, String).
Default Value (Dynamic): The initial starting state assigned to the memory variable upon creation or system boot (e.g., False, 0, 21.5, "Idle").
Access Level (Dropdown): Restricts access permissions (ReadWrite allows dynamic updating by rules/clients; ReadOnly locks the point as a constant or external read-only tag).
Max Size (Integer): Applicable for string data types, setting the maximum allowed character buffer allocation.
Persistent (Checkbox): When checked, the point's latest runtime value is continuously written to local disk storage, ensuring state recovery following server reboots or power outages.
3.4.4 Tab 2: Live Data
Provides real-time inspection of active values passing through or resting within internal storage.
Point ID & Name: Identifies the specific memory address.
Value Type: Data classification.
Value: Renders the current live value in a highly readable, monospaced Consolas font.
Timestamp: Exact UTC timestamp of the last recorded value mutation.
Actions (Output Target): A dedicated edit button allowing technicians to manually override and write a specific value directly into the storage point for simulation or forced override.
3.5 JSON Objects
The JSON Objects view manages custom metadata schemas used to parse, flatten, and extract deeply nested JSON payloads originating from HTTP endpoints, MQTT topics, or Webhook receivers.
3.5.1 Toolbar & Filtering
Add Schema (+): Opens the schema designer to map JSON property keys to strongly typed collection fields.
Search & Category Filters: Quickly isolates object schemas by matching text or categorical groupings.
Description / Notes: Contextual documentation regarding the expected payload structure.
Date Added: Creation timestamp.
3.5.3 Adding a JSON Object Schema
To define a new custom payload template, click Add Schema (+) in the upper toolbar and configure the following parameters:
Friendly Name (String): The unique schema identifier referenced inside Rule Graph nodes (e.g., Milestone_Event_Record).
Category (String): An organizational grouping tag used for filtering and sorting (e.g., Security, Sensors, HVAC).
Description / Notes (String): Contextual documentation explaining the payload source or intended use case.
Schema Properties Table: The core mapping structure where engineers define individual payload variables. Click Add Property (+) to configure each field:
Property Key / Path (String): The exact JSON key name or path to extract from incoming text (e.g., alarmState, event.id, device.temperature).
Data Type (Dropdown): Expected structural conversion format (String, Integer, Double, Boolean, Vector).
3.6 Logs
The Logs view provides a high-fidelity, real-time diagnostic stream of system events, protocol driver communications, and rule execution traces.
3.6.1 Toolbar Actions
Auto Scroll Checkbox: Toggles automatic tailing of incoming log entries.
Export ([Icon]): Dumps active in-memory log history to an external disk file for auditing.
Clear ([Icon]): Flushes the active view buffer.
3.6.2 Granular Filter Bar
Four dedicated input fields allow precise log isolation:
Time Filter: Matches specific hour/minute/second patterns.
Level Filter: Dropdown filtering by severity (*Info*, *Warning*, *Error*, *Debug*).
Region Filter: Filters by subsystem or protocol driver module (e.g., *OpcUaSvc*, *RuleEngine*).
Message Filter: Full-text search across log contents.
3.6.3 Log Data Grid
Displays exact timestamps, color-coded severity levels, operational regions, and multi-line wrapping message blocks formatted in monospaced typography. Action: Double-clicking any log row opens a detailed modal window displaying complete stack traces and execution metadata.
3.7 Settings
The Settings view configures core runtime parameters, email alert notifications, user management accounts, and system licensing across dedicated settings tabs.
3.7.1 Toolbar Actions
Save Settings ([Icon]): Commits changes to system configurations, persists settings to config.json, and triggers dynamic backend service reloading.
3.7.2 Tab 1: General & Logging
Diagnostic Logging Verbosity: Dropdown selector adjusting the detail level written to system log buffers (*Error Only*, *Normal*, *Detailed*, *Debug Trace*).
Plugin Repository URL: URL or local filesystem path pointing to the plugin repository catalog repository.json.
Inactivity Logout (min): Automatic session security expiration timeout in minutes (0 to disable auto-logout).
3.7.3 Tab 2: Email Notifications
The Email Notifications tab manages outbound SMTP communication settings for automated alert dispatching. When system alerts (such as source connection faults, hardware offline states, or recovery events) are created by UniflowWorker, the service layer formats and transmits HTML email notifications to designated recipients.
Enable email notifications (Checkbox): Global master switch enabling automated email notification dispatching when alerts are raised by the background service.
SMTP Server Configuration:
SMTP Host & Port: Specify the outbound MailKit SMTP server address (e.g. smtp.example.com or 192.168.1.100) and network port (defaults to 587).
Encryption Security (Dropdown): Select the required transport layer security mode:
None: Unencrypted SMTP transport (typically port 25 or 587).
SslTls: Implicit SSL/TLS encryption upon initial socket connect (typically port 465).
StartTls: Explicit STARTTLS connection upgrade (typically port 587).
SMTP Username & Password: Authentication credentials required by the target SMTP relay server.
Skip SSL/TLS Certificate Validation (Checkbox): When enabled, bypasses strict SSL/TLS X.509 certificate chain validation to support self-signed certificates or internal Enterprise CAs.
Recipient & Sender Addresses:
From Email Address: Sender email address populated in the From header of outbound emails (e.g. alerts@uniflow.local).
Sender Display Name: Friendly display name associated with outbound alert messages (defaults to Uniflow Alerts).
Recipients (TextArea): Comma-separated list of recipient email addresses receiving alert notifications (e.g. operator@company.com, admin@company.com).
Test Email Configuration (Send Test Email Button):
Automatically saves current settings to the service backend and triggers an immediate test email dispatch via the TestAlertEmail IPC command.
Displays success confirmation or detailed SMTP negotiation failure messages directly within a GUI dialog.
3.7.4 Tab 3: User Management
Allows administrators to create and manage application user accounts, assign security roles (*Admin*, *Operator*), and reset access credentials.
Anti-Brute-Force Lockout Protection: To safeguard endpoints against unauthorized credential guessing and automated dictionary attacks, the background service enforces an IP-bound lockout mechanism (BlockedIpManager). Each client IP address is allowed up to 3 failed login attempts. Upon failing the 3rd consecutive attempt, the client IP address is temporarily blocked for 5 minutes. Lockouts and attempt tracking are strictly bound to the originating client IP address (independent of which username or account is attempted), and a successful login from that IP resets its failed attempt counter.
3.7.5 Tab 4: Plugins (Plugin Manager)
The Plugins tab provides a centralized marketplace and local lifecycle manager for extending Uniflow with industrial protocol drivers, enterprise cloud connectors, visual controls, and AI inference engines. Available exclusively to administrators, the Plugin Manager coordinates with UniflowService and the remote repository catalog (repository.json).
Search & Dynamic Filters:
Search Plugins (TextBox): Filter plugins by name, ID, or description keywords in real time.
Status Filter (Dropdown): Filter the catalog by installation state:
All: Displays all registered official and custom plugins.
Installed: Filters for plugins currently loaded and active in the local service runtime.
Not Installed: Highlights plugins available in the remote repository ready for download.
Update Available: Isolates installed plugins that have a newer version available in the repository.
Refresh Catalog (Button): Queries the configured Plugin Repository URL (with local disk icon fallback and fast network timeouts) to fetch the latest plugin manifests and version metadata.
Upload Plugin Package (Button): Allows administrators to install offline custom or private plugins directly by selecting a .zip plugin package containing plugin.json and compiled assemblies. Uniflow automatically verifies the package structure, validates minimum system version compatibility, and registers the plugin without requiring application re-installation.
Plugin Card Anatomy & Lifecycle Actions:
Plugin Identity: Displays high-resolution plugin icon, friendly display name, author / vendor badge, current installed version, latest available repository version, and package license tier (*Free* vs. *PRO*).
Install (Primary Button): Initiates asynchronous background downloading from the repository server with an animated progress bar and byte counter, followed by automated verification and collectible AssemblyLoadContext (ALC) dynamic loading.
Update (Warning Button): Displays when a newer semantic version is available in the repository. Clicking prompts an update confirmation dialog highlighting new release notes, seamlessly downloading the update and reloading the plugin sandbox.
Uninstall (Danger Button): Gracefully stops active source adapters bound to the plugin and triggers garbage collection of the collectible ALC sandbox from both the backend service and client session cache.
Release Notes (Action Link): Opens the Plugin Release Notes Dialog detailing version changelogs, bug fixes, and feature additions across historical versions.
Legal & License Terms (Action Link): Opens the Plugin Legal Information Dialog displaying vendor copyright notices, third-party library attributions, and license agreements.
Compatibility & Licensing Guardrails:
Version Compatibility: Each plugin specifies MinSystemVersion. If the running UniflowService version does not satisfy the plugin's minimum version requirement, the Install button is disabled with an explanatory tooltip.
License Tier Restrictions: When operating under a Free license tier, installation of PRO-tier commercial plugins is protected and requires an upgraded license key in Tab 5.
3.7.6 Tab 5: System License Management
License Request Code: A read-only text box generating a unique hardware identifier for the hosting machine. Includes a Copy Code button to send to support for license issuance.
System License Key: Input area to paste active license cryptographic strings.
Status Badge Card: Dynamic shield display reflecting active validation state:
LICENSED SYSTEM (Teal/Green border & badge).
UNLICENSED SYSTEM (Red border & badge).
LICENSE EXPIRED (Red border & badge).
Allowed Capacity Limits Table: Displays an exact table of permitted source connections based on the active license (e.g., *ModbusTcp: 10 allowed*, *OpcUa: 5 allowed*).
4. Rule Editor & Graph Nodes
4.1 Philosophy of Uniflow Rules
Visual rules act as the intelligent "nervous system" of Uniflow. Rather than relying on continuous, CPU-heavy polling loops, rules are strictly event-driven. When a source adapter ingests a telemetry frame or an internal storage point changes value, the rule engine instantly awakens, evaluates the connected logic graph from left to right, executes decision branches, and dispatches outbound control commands.
4.1.1 Core Execution Mechanics & Concurrency
Understanding how the rule engine processes logic is essential for designing robust automation:
Event Awakening & Concurrency: Rules execute asynchronously across multi-threaded thread-pool workers. When multiple independent source adapters or storage points emit telemetry simultaneously, their bound rules are dispatched and evaluated in parallel, ensuring high-throughput ingestion without single-threaded bottlenecks.
Deterministic Order of Execution: Within an awakened rule graph, node evaluation strictly follows a topological ordering (from upstream data ingest to downstream sinks). A functional logic node (e.g., Addition or Greater Than) will not evaluate until all upstream wire connections delivering its input parameters are fully resolved.
Branching & Sinks: Conditional flow control blocks (such as Branch (If / Else)) evaluate boolean expressions to dynamically route execution down isolated graph pathways. The evaluation cycle completes when all active branches terminate at outbound action sinks (e.g., Output Target).
Target Contention & Priority: When multiple concurrent rules attempt to write to the identical internal storage point or external protocol register, write operations are processed thread-safely. During simultaneous event storms, the execution scheduler prioritizes evaluations based on each rule's configured Priority Level (higher priority rules evaluate first). However, engineers should design rules defensively to avoid uncoordinated competing writes that cause unpredictable value overwriting.
Feedback Loops & Recursion Breaker: If a rule graph binds to a specific storage point as its input source and subsequently executes an Output Target action targeting that exact same storage point, committing the write instantly re-triggers the rule, initiating a circular feedback loop. To protect host CPU resources from infinite recursion lockups, Uniflow enforces a rigorous, hardcoded safety limit of 10 triggers. If a self-triggering loop or chained circular sequence exceeds this immutable maximum depth, the engine immediately aborts execution and logs a recursion safety fault.
4.1.2 Rule Re-Entrancy, Concurrency Gates, and Execution Overlap
When designing high-frequency automation rules, it is vital to understand how the engine handles overlapping executions of the same rule:
Every rule compiled in Uniflow possesses its own dedicated, isolated concurrency gate. Rule executions are strictly isolated per rule definition: Rule A running never blocks or delays Rule B. However, for any single rule, executions do not run concurrently with themselves. An evaluation cycle holds its rule's gate until all intermediate logic finishes and all outbound action sinks complete.
Sequential Evaluation of Outbound Actions:
If a rule defines multiple action sinks (e.g., Action 1: *Save Snapshot to Folder* via ONVIF, followed by Action 2: *Insert Database Record* via Postgres), the rule engine executes and awaits these actions sequentially in topological order. Action 2 will not begin until Action 1 has fully completed (or timed out). If Action 1 involves a high-latency physical operation (such as camera network acquisition and file writing), the rule's gate remains held for that entire duration.
What Happens When the Same Rule is Triggered Again:
If an incoming trigger arrives while a previous execution of that same rule is still running, the engine's behavior is determined by the input node kind:
Telemetry / Value Streams (InputSource) → Backpressure Drop:
Continuous telemetry feeds (e.g., MQTT topic subscriptions, Modbus cyclic polling, OPC UA value updates) operate on "latest value" semantics. If the rule is currently busy executing, queuing incoming values would cause creeping latency delays and unbounded memory buildup. Instead, the engine performs a zero-wait try-lock (gate.WaitAsync(0)). If the gate is busy, the incoming trigger is immediately dropped and a backpressure skip activity is registered.
Push-based event streams (e.g., VMS security alarms, badge access events, discrete sensor triggers) represent unique historical occurrences where every single event is critical. For rules triggered by an EventInput, incoming events queue up at the gate (await gate.WaitAsync(ct)). Each queued event waits its turn and evaluates in order, ensuring zero discrete events are lost.
4.2 Creating and Debugging Rules
Clicking Add Rule instantly redirects the engineer to a fresh visual canvas editor. No preliminary dialog is presented. Instead, a new rule is automatically initialized with sensible defaults:
Rule Name: Defaults to New Rule.
Group: Defaults to General.
Priority Level: Defaults to 50.
Enabled State: Enabled (true) by default.
4.2.1 Configuring Rule Identity and Metadata
At any point during rule design, the engineer can configure these identity fields directly in the top header panel of the Rule Editor:
Rule Name (TextBox): A clear, unique identifier describing the rule's exact purpose (e.g., BoilerOverheatProtection, BadgeAccessGranted).
Group (ComboBox): An organizational categorization tag allowing engineers to sort and filter large enterprise catalogs by department or subsystem (e.g., HVAC, Security, Telemetry). The field is editable, allowing you to select an existing group or type a new one.
Priority Level (ComboBox, options from 10 to 100): Determines execution precedence during simultaneous event storms. Rules assigned higher priority numbers are evaluated first by the execution scheduler.
Enabled State (CheckBox): Toggles whether the rule should begin active evaluation immediately upon saving, or remain paused in a disabled draft state.
The Rule Editor provides a comprehensive suite of visual controls and shortcuts organized across the top action toolbar, the header metadata bar, and the floating canvas overlay panel:
a) Top Action Toolbar
Positioned at the very top of the editor, this toolbar manages graph file lifecycle operations and full state history:
Reset (ArrowReset icon): Clears the active canvas and restores the rule graph to its clean default state. If unsaved edits are present on the canvas, a confirmation dialog appears before resetting.
Import (ArrowImport icon): Opens a file dialog to load and parse an external .json rule definition file into the active workspace, prompting confirmation if unsaved changes exist.
Export (ArrowExport icon): Serializes the current rule graph structure, node positions, port bindings, and wire connections into a portable .json file for backup, version control, or migration across systems.
Delimiter Separator: A clean vertical divider line visually isolating file lifecycle actions from the history stack controls.
Undo (ArrowUndo icon | Ctrl+Z): Reverts the most recent action on the rule graph. Provides complete text editor parity across all graph mutations:
Adding or deleting nodes
Adding, replacing, or disconnecting wire connections
Moving or dragging nodes across the canvas
Modifying node properties or data bindings in the Inspector (with intelligent 400 ms typing debouncing)
Switching connection wire routing styles (Curved vs. Right-Angled)
Canvas reset and external graph import operations
Dynamic Tooltips: Reflect the exact action being reverted (e.g., *Undo Add Node: InputSource (Ctrl+Z)* or *Can't Undo* when the history stack is empty).
Context-Aware Keyboard Handling: When typing inside an inspector text box, native WPF intra-text undo/redo takes precedence; canvas-level graph undo takes effect as soon as focus leaves the text field or is anywhere on the canvas.
Capacity: Maintains a bounded memory stack of up to 100 historical snapshot states.
Redo (ArrowRedo icon | Ctrl+Y / Ctrl+Shift+Z): Re-applies the most recently undone action. Features dynamic tooltips describing the action to be reapplied (e.g., *Redo Move Node: Addition (Ctrl+Y)* or *Can't Redo* when no further forward actions exist).
b) Rule Header Navigation & Save Bar
Positioned directly beneath the action toolbar:
Back Arrow (Rules button | ArrowLeft icon): Safely exits the Rule Editor and returns to the main Rules table. Prompts the operator before discarding unsaved canvas edits.
Save Rule (Accent Blue Button | Segoe MDL2 \uE74E): Validates the visual graph, compiles the node logic pipeline, and transmits the compiled rule to UniflowService via IPC. Automatically disabled while an asynchronous save operation is in progress.
Rule Name (TextBox): Direct inline text editor for naming the rule.
Enabled (CheckBox): Master execution switch toggling active runtime evaluation.
Group (ComboBox): Assigns the rule to an existing organizational group or allows typing a new category name.
Priority (ComboBox): Assigns scheduling precedence (10 to 100).
Compile Status Badge: Live visual indicator (Green dot = *Compiled*, Red dot = *Errors*, Amber dot = *Warnings*) with hover tooltips detailing any graph compilation or schema validation issues.
c) Floating Canvas Overlay Controls
Hovering at the top-left of the canvas surface provides immediate viewport framing and wire rendering controls:
Fit (⛶ Fit button): Instantly pans and zooms the canvas viewport to comfortably frame all nodes currently placed on the canvas.
Preview (Eye icon button): Launches the dedicated Live Rule Runtime Preview window to monitor real-time execution pulses and diagnostic traces without leaving the workspace.
Right-Angled Routing (Stairs toggle button): Renders wire connections as clean orthogonal right-angled segments featuring obstacle avoidance around nodes, filleted 90-degree corner arcs, and semicircular crossover bridge jumps over intersecting lines.
d) Floating Canvas Minimap
Positioned at the bottom-right corner of the canvas:
Minimap (RuleMinimapControl): Real-time miniature layout display showing all nodes, connections, and an interactive viewport bounding frame. Supports expanding, collapsing, and fast canvas panning across expansive rule topologies.
4.2.3 Required Nodes in a Functional Rule
For a visual graph to compile and execute successfully, it cannot just be a set of intermediate calculations. Every rule must follow a clear execution pipeline comprising at least one Trigger/Ingestion node and at least one Action/Sink node:
Trigger / Ingestion Node:
The entry point of a rule. It initiates graph execution upon receiving telemetry changes or external signals.
Input Source: Ingests continuous telemetry points (e.g., Modbus registers, OPC UA variables) or internal memory storage registers.
Event Input: Ingests push-based system events (e.g., VMS motion alerts, SIA receiver signals).
*Note*: Without an ingestion node, the rule's logic has no starting trigger and will never evaluate.
Action / Sink Node:
The termination point of a rule. It converts in-memory evaluated results into physical or external impact.
Output Target: Writes the final calculated data back to a device address or triggers system actions (e.g., toggling a Modbus coil, triggering a Milestone VMS alarm, writing a temperature setpoint to BACnet, or updating an Internal Storage point).
*Note*: Without an action/sink node, a rule will evaluate its logic successfully in memory but will produce no external side effects or actions.
4.2.4 Connecting Graph Nodes: Mapping the Flow from Source to Sink
Once the required ingestion and action nodes are placed on the canvas along with any necessary intermediate functional blocks (math, comparisons, timers), the logic flow is established by connecting ports:
a) Understanding Ports:
Input Ports (Left side of node): Receive incoming data values or trigger signals from upstream nodes.
Output Ports (Right side of node): Emits calculated values, boolean matches, or execution triggers.
b) Drawing Connections:
Hover over an output port on an upstream node (the cursor changes to a connection tool).
Click and drag a connection wire from the output port.
Drop the wire onto a compatible input port on a downstream node (e.g., connecting a boolean output to a logical gate input).
Repeat this process to map the complete sequence of operations, carrying data smoothly from the trigger source, through the mathematical and logical processing blocks, and finally into the input ports of the Output Target data sink node.
c) Data Flow Validation:
Connections must map compatible data types (e.g., passing a float to a float math input).
The visual editor automatically highlights valid ports and blocks invalid or recursive connections to ensure static compilation stability before metadata is saved.
4.2.5 Real-Time Rule Execution Debugging
To facilitate seamless validation, troubleshooting, and tuning of complex automation workflows, Uniflow features a state-of-the-art Live Rule Runtime Preview engine. Instead of debugging in isolation or reading raw text logs, operators can observe their logic executing in real time directly on the visual canvas.
a) Initiating a Live Debugging Session
To attach the debugger to a rule:
Step 1. Navigate to the Rules section in the main navigation.
Step 2. Select the desired rule from the list grid.
Step 3. Click the Preview Rule (Live Execution Trace) button on the grid toolbar.
Step 4. This launches the dedicated Rule Runtime Preview window, which automatically subscribes to the background UniflowService runtime engine via named pipes to stream live telemetry and event execution traces.
b) Dynamic Flow Pulsing (Canvas Tracing)
The preview canvas updates dynamically, using colored glowing "pulses" to visualize data flow and execution frequency:
Computational State Pulses: Nodes and wire connections emit immediate glowing pulses corresponding to their result state:
Teal Glow (Succeeded): Indicates that the node evaluated successfully without errors.
Red Glow (Failed): Indicates that the node encountered a runtime exception or failed evaluation.
Amber Glow (Skipped): Indicates that the node was bypassed due to logical branching.
Deep Blue Glow (Running): Indicates an ongoing asynchronous task or loop execution.
Execution Path & Value Propagation: Active value transitions trigger distinct Bright Blue or Purple pulses along the connections to indicate exactly how data travels through ports.
Fading & Temporal Decay: Older execution pulses automatically fade away over a brief, calculated interval. This creates a temporal trail, allowing operators to visually see the frequency, speed, and exact path of the latest trigger events.
c) Integrated Diagnostics & Live Logs Terminal
Complementing the visual canvas is a detailed log terminal displaying a synchronized millisecond-precise live feed of rule activities:
Millisecond-precise Timestamps: Logs are stamped in a high-precision format (HH:mm:ss.fff) to capture fast-moving, high-frequency triggers.
Color-Coded Severity Levels:
INFO (Blue): General attachment, session state, and diagnostic connections.
RULE (Teal): Global rule execution starts, finishes, and broad outcomes.
Continuous Stream Auto-Scroll & Pause Mode: Incoming traces and logs automatically append and scroll to the newest entry as they arrive. To freeze the stream and inspect a specific historical trace in detail, click the Pause button.
Fit to View: Click the Fit command to instantly scale and center the canvas, keeping large and complex rule topologies fully visible at a glance.
4.3 Anatomy & Meaning of Graph Nodes
Once metadata is committed, the user enters the visual canvas. Logic is constructed by connecting functional building blocks known as Nodes.
4.3.1 What is a Graph Node?
A Graph Node represents a self-contained, atomic execution unit designed to perform a specific, focused task. Conceptually, every node operates on a simple three-stage principle: it ingests incoming data parameters across its input ports, executes its designated internal logic transformation (such as calculating a mathematical equation, filtering a signal, or evaluating a logical comparison), and immediately pushes the resulting calculated values or control flow commands outward through its output ports.
Input Ports (Left side): Receive data values or execution control flows from upstream nodes.
Output Ports (Right side): Transmit the resulting data values or branched execution flows onward to downstream nodes.
4.3.2 Port Data Types & Color System
Every input and output port on the visual canvas is color-coded by its underlying data type, allowing operators to immediately discern schema structures and verify connection type compatibility at a glance:
Data Type
Visual Color
Hex Code
Description & Semantics
Bool
Medium Sea Green
#3CB371
Boolean state signal (True or False).
Int
Cornflower Blue
#6495ED
32-bit signed integer or discrete counter.
Double
Teal
#008B8B
High-precision 64-bit IEEE floating-point number.
String
Orange
#FFA500
Text string payload or UTF-8 message.
ByteArray
Light Brown
#C49A6C
Raw binary buffer (e.g. byte frames, images, payloads).
DateTime
Orchid
#DA70D6
Timestamp representation with timezone context.
Trigger
Indian Red
#CD5C5C
Pulse execution signal without data payload.
Collection
Purple
#9370DB
Metadata-backed enumerable array of structured object records.
Vector
Aquamarine
#7FFFD4
3D spatial vector (Vector3) containing X, Y, Z coordinates.
BoolArray
Dark Green
#006400
Array list of boolean states.
IntArray
Royal Blue
#4169E1
Array list of integer numbers.
DoubleArray
Light Sea Green
#20B2AA
Array list of double-precision numbers.
StringArray
Dark Orange
#FF8C00
Array list of text strings.
Any
Light Gray
#D3D3D3
Polymorphic dynamic port accepting any supported primitive or object.
4.3.3 Node Inspector Layout & Ergonomics
When a node is selected on the canvas, its configuration panel opens in the right-side inspector:
Input Port Data Bindings Positioned at Top: For all graph nodes, property editors that correspond to incoming connection ports (e.g. Value, Other, OP, CLK, PV) are systematically pinned at the very top of the BINDING group. This ensures operators can immediately review static values or wire bindings without scrolling through general node parameters.
Spacious Multiline Editors with Auto-Scrolling: Long string arguments and multiline payloads (such as Constant String and String Equal's "Other" argument) feature word wrapping and automatic vertical scrollbars with a maximum height of 220px, providing comfortable viewing and editing without distorting the inspector pane.
4.4 Exhaustive Graph Node Catalog
Below is the complete, exhaustive catalog of all 78 visual graph nodes available in Uniflow, organized by category, matching the exact icon bindings, port definitions, and operational behaviors of the Uniflow Rule Engine.
4.4.1 Sources In/Out (Ingest)
Nodes that initiate workflow execution or read live telemetry and memory variables into the graph.
Input Source
Property
Details
Description
Ingests continuous telemetry points or internal storage variables sampled by active source adapters or memory registers.
Inputs
None
Outputs
Dynamic Point Fields (Varies by configuration). Renders specific output ports for each selected point or memory tag, outputting their live values in their configured data type.
Settings
None
Event Input
Property
Details
Description
Subscribes to complex, structured event streams (such as VMS alarms, motion events, or Lidar intrusion alerts) emitted by a configured source adapter. When the target event fires, this node awakens the rule graph.
Inputs
None
Outputs
Trigger (Boolean) - True pulse when event is received Payload (Any) - Full event data payload string or object. Dynamic event output ports generated on configuration.
Settings
Event Configuration: Dialog mapping specific event properties to dynamic node output ports.
Data Source
Property
Details
Description
Reads the current runtime value of specific Data Points configured within an active source adapter on demand.
Inputs
None
Outputs
Dynamic Point Fields (Varies by configuration). Renders output ports for each selected data point emitting its live value.
Settings
None
4.4.2 Actions & Sinks
Nodes that execute state changes, write data outward, or trigger external actions.
Output Target
Property
Details
Description
Acts as an outbound action sink. When triggered, it captures incoming data variables and writes them outward to a targeted internal storage point, external protocol register, or internal system service (such as Alerts).
• System Alerts Target: When bound to the internal Alerts source and Alert item, the node exposes two dynamic argument fields/ports: 1. Level (*Dropdown / String*): Alert severity level (Warning, Info, or Critical). 2. Message (*String*): Custom alert text message (supports static entry or dynamically wired strings). When triggered by a rule, the generated alert is published immediately to the Dashboard/Topology view and dispatches an automated HTML email notification to configured recipients if email sending is enabled in Settings.
Inputs
Trigger (Boolean) - Pulse to initiate write Value / Arguments (Level, Message, etc.) - Data payload or structured action arguments to write.
Outputs
None
Settings
• Trigger Mode: Repetitive, OnceOnTrue, OnceOnFalse, OnAnyChange. • Cooldown (ms): Minimum interval between operations to prevent hardware flooding. • Debounce (ms): Signal stability duration required before committing. • Write Policy: Always, OnChange, OnChangeWithTolerance, ForceInterval.
4.4.3 Constants
Nodes providing static, unchangeable primitive values into the graph.
Constant Number
Property
Details
Description
User-defined static 32-bit integer or floating-point number.
Inputs
None
Outputs
Value (Integer/Double) - Static numeric value.
Settings
Value: Numeric constant value.
Constant Boolean
Property
Details
Description
User-defined static Boolean value.
Inputs
None
Outputs
Value (Boolean) - Static boolean state.
Settings
Value: True or False state selectable via an interactive dropdown in the inspector. The node subtitle dynamically reflects the selected state (true or false).
Constant String
Property
Details
Description
User-defined static text string.
Inputs
None
Outputs
Value (String) - Static string value.
Settings
Value: Text string value.
Constant Array
Property
Details
Description
User-defined static array of primitive values (strings, integers, doubles, or booleans).
Inputs
None
Outputs
Array (Array) - Static array output.
Settings
Items: Collection of static array elements.
Vector
Property
Details
Description
Constructs a 3D vector object (Vector3) from X, Y, Z components or extracts individual component scalar outputs and magnitudes.
Inputs
X (Double), Y (Double), Z (Double) - Component values (can be provided via incoming port wires or configured via node inspector properties).
Outputs
Vector (Vector) - 3D Vector object (Vector3) X (Double), Y (Double), Z (Double) - Component scalar values Magnitude (Double) - Euclidean length (\
• X: X component property value. • Y: Y component property value. • Z: Z component property value.
Current Time
Property
Details
Description
Emits the current date and time as a formatted string, DateTime object, or Unix timestamp.
Inputs
None
Outputs
Str (String) - Formatted date/time text DT (DateTime) - DateTime object Unix Time (s) (Double) - Unix epoch seconds Unix Time(ms) (Double) - Unix epoch milliseconds.
Settings
• Mode: - ISO 8601 UTC: Outputs ISO 8601 formatted UTC timestamp with Z suffix (e.g. 2026-08-21T08:45:00Z). - ISO 8601 Local: Outputs ISO 8601 formatted local timestamp with offset (e.g. 2026-08-21T11:45:00.000+03:00). - Pattern: Custom format pattern applied to local time (defaults to yyyy-MM-dd HH:mm:ss). - Utc: Formatted UTC timestamp. - Local: Formatted local timestamp with offset. - Timestamp: Unix epoch timestamp in milliseconds. • Format: Custom date format string (e.g. yyyy-MM-ddTHH:mm:ssZ or yyyy/MM/dd HH:mm:ss).
Guid
Property
Details
Description
Generates a unique 128-bit GUID string identifier.
Inputs
None
Outputs
Guid (String) - Generated GUID text.
Settings
None
4.4.4 Logic & Comparisons
Nodes executing logical operations and boolean comparison checks.
Greater Than
Property
Details
Description
Tests if input A is strictly greater than input B (A > B).
Inputs
Left (Number), Right (Number)
Outputs
Result (Boolean) - True if Left > Right.
Settings
None
Greater Than or Equal
Property
Details
Description
Tests if input A is greater than or equal to input B (A >= B).
Inputs
Left (Number), Right (Number)
Outputs
Result (Boolean) - True if Left >= Right.
Settings
None
Less Than
Property
Details
Description
Tests if input A is strictly less than input B (A < B).
Inputs
Left (Number), Right (Number)
Outputs
Result (Boolean) - True if Left < Right.
Settings
None
Less Than or Equal
Property
Details
Description
Tests if input A is less than or equal to input B (A <= B).
Inputs
Left (Number), Right (Number)
Outputs
Result (Boolean) - True if Left <= Right.
Settings
None
Equal
Property
Details
Description
Compares two inputs for exact equality.
Inputs
Left (Dynamic), Right (Dynamic)
Outputs
Result (Boolean) - True if values match exactly.
Settings
None
Not Equal
Property
Details
Description
Compares two inputs for inequality.
Inputs
Left (Dynamic), Right (Dynamic)
Outputs
Result (Boolean) - True if values differ.
Settings
None
Logical AND
Property
Details
Description
Evaluates logical conjunction across boolean inputs.
Inputs
Input A (Boolean), Input B (Boolean)
Outputs
Result (Boolean) - True if both inputs are true.
Settings
None
Logical OR
Property
Details
Description
Evaluates logical disjunction across boolean inputs.
Inputs
Input A (Boolean), Input B (Boolean)
Outputs
Result (Boolean) - True if at least one input is true.
Settings
None
Logical NOT
Property
Details
Description
Inverts the incoming boolean signal.
Inputs
Input (Boolean)
Outputs
Result (Boolean) - Inverted boolean signal.
Settings
None
Logical XOR
Property
Details
Description
Evaluates exclusive OR across boolean inputs.
Inputs
A (Boolean), B (Boolean)
Outputs
Result (Boolean) - True if exactly one input is true.
Settings
None
Is NULL
Property
Details
Description
Checks if the input value is null or undefined.
Inputs
Input (Dynamic)
Outputs
Result (Boolean) - True if input is null.
Settings
None
Default Value (Coalesce)
Property
Details
Description
Returns the primary input if non-null otherwise falls back to the default value.
Inputs
Input (Dynamic) - Primary value Default (Dynamic) - Fallback value.
Outputs
Result (Dynamic) - Coalesced non-null result.
Settings
None
4.4.5 Flow Control
Nodes controlling branching, routing, and conditional execution paths.
Branch (If / Else)
Property
Details
Description
Selects between two value payloads based on a boolean condition evaluation.
Inputs
Condition (Boolean) - Control signal TrueValue (Dynamic) - Output if true FalseValue (Dynamic) - Output if false.
Outputs
Result (Dynamic) - Selected value payload.
Settings
None
Multi-Condition If
Property
Details
Description
Evaluates multiple comparison condition groups combined with logical ALL (AND) or ANY (OR) semantics and outputs a boolean result. The node subtitle dynamically reflects the active mode and condition count (e.g., ALL (2), ANY (3)).
Inputs
Dynamic Operand Inputs (L1, R1, L2, R2, etc.) dynamically generated for each condition group. Both left and right operand ports automatically adapt their data type (Double, Int, String, Bool) to match the data type selected for that condition group.
Outputs
Result (Boolean) - Emits True if the combined conditions evaluate to true according to the selected mode (ALL or ANY), otherwise False.
Settings
• Mode: Combination mode — ALL (all conditions must evaluate to true) or ANY (at least one condition must evaluate to true). • Conditions: Configurable list of condition groups managed via + Add Condition: • Data Type: Selects the unified data type (Double, Int, String, Bool) for the condition group, dynamically adjusting both left (L{n}) and right (R{n}) input ports. • Operator: Comparison operator tailored to the chosen data type (relational ==, !=, >, >=, <, <= for numeric types equality ==, != for strings and booleans).
Switch
Property
Details
Description
Compares an input value against multiple user-defined cases for multi-way branching. The node subtitle dynamically updates to display the active branch count (e.g., 1 case, 3 cases).
Inputs
Value (Dynamic) - Tested input value.
Outputs
Dynamic Case Outputs (Case 1, Case 2, etc.) emitting True on match Default (Trigger) - Emits pulse when no case matches.
Settings
• Input Type: Data type of tested value (String, Int, Double, Bool). • Cases: Configurable lookup table of comparison values managed via + Add Case.
Select
Property
Details
Description
Selects and routes one of multiple input data streams based on a zero-based index.
Inputs
Index (Number) - Selector index (0 -> In 0, 1 -> In 1, etc.) In 0 (Dynamic) - Mandatory default input. Dynamic options (In 1, In 2...).
Outputs
Result (Dynamic) - Selected input data payload.
Settings
Input Ports: Configurable list allowing users to add or remove input option streams.
Gate
Property
Details
Description
Conditionally passes or blocks data payload based on a boolean control signal.
Inputs
Open (Boolean) - Gate control signal (True = pass, False = block) Value (Dynamic) - Data payload.
Outputs
Result (Dynamic) - Passed value payload when open, or ull when closed.
Settings
None
4.4.6 Strings
Advanced string manipulation, formatting, and pattern matching nodes.
Format
Property
Details
Description
Composes a string by inserting input values into a template with placeholders (e.g., {0}, {1}).
Inputs
Format (String) - Template string Arg 0, Arg 1... (Dynamic based on placeholders).
Outputs
Result (String) - Formatted output text.
Settings
Format String: Template string with positional index placeholders.
Regex Extract
Property
Details
Description
Extracts substrings from text using a Regular Expression pattern match.
Extracts a sequence of characters from input text starting at a specific index.
Inputs
Text (String), Start (Integer), Length (Integer)
Outputs
Result (String) - Extracted sub-string.
Settings
• Start: Starting character index (optional default if not wired). • Length: Number of characters to extract (optional default if not wired).
Replace
Property
Details
Description
Replaces all occurrences of a specific substring with another text payload.
Inputs
Text (String), Old (String) - Find text, New (String) - Replacement text.
Outputs
Result (String) - Modified string.
Settings
• Old: Search substring to find and replace (optional default if not wired). • New: Replacement string payload (optional default if not wired).
Contains
Property
Details
Description
Checks if the input text contains a specific search substring.
Inputs
Text (String), Value (String) - Search substring.
Outputs
Result (Boolean) - True if substring is found.
Settings
Value: Search substring to check (optional default if not wired).
Equal
Property
Details
Description
Compares two strings for exact character-for-character equality.
Inputs
Text (String), Other (String)
Outputs
Result (Boolean) - True if strings match.
Settings
Other: Multiline text editor for comparing large or multiline string values when not wired (supports expanding height up to 220px with automatic vertical scrolling).
IndexOf
Property
Details
Description
Returns zero-based position of first substring occurrence (-1 if not found).
Inputs
Text (String), Value (String) - Substring to search.
Outputs
Result (Integer) - 0-based position (-1 if not found).
Settings
Value: Substring to search for (optional default if not wired).
Trim
Property
Details
Description
Removes leading and trailing whitespace from input text.
Inputs
Text (String)
Outputs
Result (String) - Trimmed text string.
Settings
None
Upper
Property
Details
Description
Converts all characters in input text to uppercase. Displays dynamic subtitle to Upper on the canvas.
Inputs
Text (String)
Outputs
Result (String) - UPPERCASE text string.
Settings
None
Lower
Property
Details
Description
Converts all characters in input text to lowercase. Displays dynamic subtitle to Lower on the canvas.
Inputs
Text (String)
Outputs
Result (String) - lowercase text string.
Settings
None
Length
Property
Details
Description
Returns total number of characters in input text.
Inputs
Text (String)
Outputs
Result (Integer) - Character count.
Settings
None
Is Empty
Property
Details
Description
Checks if input text is null or empty.
Inputs
Text (String)
Outputs
Result (Boolean) - True if null or empty.
Settings
None
4.4.7 Arithmetic Math
Nodes performing core numeric arithmetic across floating-point and integer types.
Addition
Property
Details
Description
Calculates the sum of two numeric inputs (Left + Right).
Inputs
Left (Number), Right (Number)
Outputs
Result (Number) - Total sum.
Settings
None
Subtraction
Property
Details
Description
Calculates the difference between numeric inputs (Left - Right).
Inputs
Left (Number), Right (Number)
Outputs
Result (Number) - Difference.
Settings
None
Multiplication
Property
Details
Description
Calculates the product of two numeric inputs (Left * Right).
Inputs
Left (Number), Right (Number)
Outputs
Result (Number) - Product.
Settings
None
Division
Property
Details
Description
Calculates the quotient of left input divided by right input (Left / Right).
Inputs
Left (Number), Right (Number)
Outputs
Result (Number) - Quotient.
Settings
None
Square Root
Property
Details
Description
Calculates the square root of the input value.
Inputs
Value (Number)
Outputs
Result (Number) - Square root calculation.
Settings
None
Power
Property
Details
Description
Calculates base raised to a specified power exponent.
Inputs
Base (Number), Exponent (Number)
Outputs
Result (Number) - Calculated power.
Settings
None
Logarithm
Property
Details
Description
Calculates logarithm of a number in a specified base.
Inputs
Value (Number), Base (Number)
Outputs
Result (Number) - Calculated logarithm.
Settings
None
Sine
Property
Details
Description
Calculates sine of an angle in radians.
Inputs
Angle (Number) - Angle in radians.
Outputs
Result (Number) - Trigonometric ratio.
Settings
None
Cosine
Property
Details
Description
Calculates cosine of an angle in radians.
Inputs
Angle (Number) - Angle in radians.
Outputs
Result (Number) - Trigonometric ratio.
Settings
None
Tangent
Property
Details
Description
Calculates tangent of an angle in radians.
Inputs
Angle (Number) - Angle in radians.
Outputs
Result (Number) - Trigonometric ratio.
Settings
None
Random
Property
Details
Description
Generates a pseudo-random number within a specified range (supports Double 0-1 and Integer range).
Inputs
From (Number) - Range start To (Number) - Range end.
Outputs
Result (Double/Integer) - Random result.
Settings
• From: Minimum numeric limit. • To: Maximum numeric limit.
Abs
Property
Details
Description
Calculates the absolute (positive) value of a number.
Inputs
Value (Number)
Outputs
Result (Number) - Absolute value.
Settings
None
Min
Property
Details
Description
Returns the smaller of two input values.
Inputs
A (Number), B (Number)
Outputs
Result (Number) - Minimum value.
Settings
None
Max
Property
Details
Description
Returns the larger of two input values.
Inputs
A (Number), B (Number)
Outputs
Result (Number) - Maximum value.
Settings
None
Round
Property
Details
Description
Rounds a numeric value to specified decimal precision.
Inputs
Value (Number), Precision (Integer - optional)
Outputs
Result (Number) - Rounded result.
Settings
None
Floor
Property
Details
Description
Rounds a number down to next lowest integer.
Inputs
Value (Number)
Outputs
Result (Number) - Integer rounded down.
Settings
None
Ceiling
Property
Details
Description
Rounds a number up to next highest integer.
Inputs
Value (Number)
Outputs
Result (Number) - Integer rounded up.
Settings
None
Clamp
Property
Details
Description
Constrains a value to lie within a specified minimum and maximum range.
Inputs
Value (Number), Min (Number), Max (Number)
Outputs
Result (Number) - Clamped result.
Settings
None
Vector Math
Property
Details
Description
Performs multi-mode 3D vector arithmetic, linear algebra operations, spatial transformations, and analytical projections on 3D vectors (Vector3). The active calculation mode and corresponding port definitions update dynamically based on the selected operation in the node inspector properties dropdown. Changing the operation updates both the node subtitle notation and port bindings in real time.
Inputs
Dynamic based on operation: U (Vector), V (Vector), C/P/S/M (Double scalar), Min/Max (Double scalars).
Outputs
Dynamic based on operation: Vector (Vector), Result/Norm (Double scalar), Collinear/Orthogonal (Boolean flags), or Component Mask Booleans (X > C, Y > C, Z > C).
Settings
• Operation Dropdown: Selects the vector mathematical operation to perform. Updates the node subtitle to display the mathematical notation. • Scalar Value Editors: When the selected operation uses a scalar parameter (c, p, min, max, etc.), inspector text fields are dynamically displayed to configure scalar values directly without wiring.
###### Available Vector Math Operations
The Vector Math node supports 21 distinct operations covering vector arithmetic, matrix inner/outer products, distance metrics, geometric projections, norm calculations, clipping, and component masking:
Vector: Rescales vector V to have exact target length/magnitude S.
Scalar Clamping / Clipping
clip(V, min, max)
V (Vector), Min (Double), Max (Double)
Vector: Clamps each component [vx, vy, vz] between Min and Max bounds.
Element-wise Modulo
V \bmod m
V (Vector), M (Double)
Vector: Component-wise modulo operation [vx \bmod m, vy \bmod m, vz \bmod m].
Scalar Masking
V > c
V (Vector), C (Double)
X > C (Bool), Y > C (Bool), Z > C (Bool): Boolean threshold mask per component.
4.4.8 Timers & Pulses
Industrial automation timing blocks for signal conditioning and delayed execution.
Pulse (TP)
Property
Details
Description
Generates a pulse of fixed duration when the input signal transitions to True.
Inputs
IN (Boolean) - Trigger signal PT (ms) - Pulse duration time.
Outputs
Q (Boolean) - Pulse active indicator ET (ms) - Elapsed time.
Settings
PT (ms): Pulse preset duration in milliseconds (optional default if not wired).
Timer On-Delay (TON)
Property
Details
Description
Delays the True output until the input has remained True for the preset duration.
Inputs
IN (Boolean) - Trigger signal PT (ms) - Preset delay time.
Outputs
Q (Boolean) - True after delay ET (ms) - Elapsed time.
Settings
PT (ms): On-delay preset time in milliseconds (optional default if not wired).
Timer Off-Delay (TOF)
Property
Details
Description
Keeps the output True for a set duration after the input signal transitions to False.
Inputs
IN (Boolean) - Trigger signal PT (ms) - Preset off-delay time.
Outputs
Q (Boolean) - Timer active ET (ms) - Elapsed time.
Settings
PT (ms): Off-delay preset time in milliseconds (optional default if not wired).
Value Delay
Property
Details
Description
Propagates the input signal to the output after a fixed delay time.
Inputs
IN (Any) - Value to delay PT (ms) - Delay time.
Outputs
OUT (Any) - Delayed value payload.
Settings
PT (ms): Delay duration in milliseconds (optional default if not wired).
Rising Edge (R_TRIG)
Property
Details
Description
Outputs True for exactly one scan cycle when input changes from False to True.
Inputs
CLK (Boolean) - Clock input signal.
Outputs
Q (Boolean) - Single scan pulse.
Settings
CLK: Clock boolean input signal (optional default if not wired).
Falling Edge (F_TRIG)
Property
Details
Description
Outputs True for exactly one scan cycle when input changes from True to False.
Inputs
CLK (Boolean) - Clock input signal.
Outputs
Q (Boolean) - Single scan pulse.
Settings
CLK: Clock boolean input signal (optional default if not wired).
Any Change
Property
Details
Description
Outputs True for exactly one scan cycle whenever the input value changes state.
Inputs
IN (Any) - Input signal.
Outputs
Q (Boolean) - Single scan change pulse.
Settings
None
4.4.9 Signal & State
Industrial automation logic blocks for maintaining states, latched signals, and pulse counts.
Linear Scaling
Property
Details
Description
Maps a raw numeric range (InMin/InMax) to a physical engineering range (OutMin/OutMax).
Inputs
IN (Number) - Raw value InMin (Number), InMax (Number), OutMin (Number), OutMax (Number)
Outputs
OUT (Number) - Resulting scaled engineering value.
Settings
• In Min / In Max: Raw input scaling bounds. • Out Min / Out Max: Engineering output bounds.
Moving Average (Smoothing)
Property
Details
Description
Calculates a moving average of incoming signal samples to reduce high-frequency noise.
Inputs
IN (Number) - Noisy input Samples (Integer) - Window size.
Outputs
OUT (Number) - Smoothed output signal value.
Settings
Window Size: Number of historical samples included in moving average window.
Hysteresis Filter
Property
Details
Description
Provides a deadband for stable switching, preventing signal chatter from noise.
Inputs
IN (Number) - Input signal High (Number) - Turn-on threshold Low (Number) - Turn-off threshold.
Outputs
OUT (Boolean) - Stable switch state.
Settings
• High Threshold: Level required to set output True (optional default if not wired). • Low Threshold: Level required to reset output False (optional default if not wired).
SR Flip-Flop
Property
Details
Description
Set-Reset Flip-Flop latch (Dominant Set priority).
Inputs
S (Boolean) - Set signal R (Boolean) - Reset signal.
S (Boolean) - Set signal R (Boolean) - Reset signal.
Outputs
Q (Boolean) - Latched output state.
Settings
None
Count Up (CTU)
Property
Details
Description
Increments counter on rising edge of CU. Output Q becomes True when CV >= PV.
Inputs
CU (Boolean) - Count up pulse R (Boolean) - Reset PV (Number) - Preset value limit.
Outputs
Q (Boolean) - Limit reached CV (Number) - Current count.
Settings
PV: Preset value limit threshold (optional default if not wired).
Count Down (CTD)
Property
Details
Description
Decrements counter on rising edge of CD. Output Q becomes True when CV reaches 0.
Inputs
CD (Boolean) - Count down pulse LD (Boolean) - Load PV into CV PV (Number) - Preset.
Outputs
Q (Boolean) - Zero reached CV (Number) - Current count.
Settings
PV: Preset value limit threshold (optional default if not wired).
Count Up/Down (CTUD)
Property
Details
Description
Combines both UP and DOWN counting capabilities with separate limit outputs.
Inputs
CU (Boolean), CD (Boolean), R (Boolean), LD (Boolean), PV (Number)
Outputs
QU (Boolean) - Up limit reached QD (Boolean) - Down limit reached CV (Number) - Current count.
Settings
PV: Preset value limit threshold (optional default if not wired).
4.4.10 Arrays
Managing, filtering, and performing operations on ordered lists of data.
String Split
Property
Details
Description
Converts a text string into an array of substrings using a delimiter (e.g. comma).
Inputs
IN (String) - Source text SEP (String) - Delimiter (e.g. ,).
Outputs
ARRAY (String Array) - Resulting string list.
Settings
Separator: Delimiter character or string (optional default if not wired).
Array Scope
Property
Details
Description
Iterates over a primitive array, exposing item value and index sequentially for each element.
Inputs
ARRAY (Array) - Input array.
Outputs
ITEM (Any) - Current item output INDEX (Integer) - Current array index output.
Settings
None
Filter Array
Property
Details
Description
Returns a new sub-array containing only items that match the specified comparison condition.
Inputs
ARRAY (Array), OP (Operator), VAL (Any)
Outputs
OUT (Filtered Array)
Settings
• Operator: Comparison operator dropdown (==, !=, >, >=, <, <=, contains). • Value: Target comparison value (displayed in inspector Binding group when not wired).
Any Match
Property
Details
Description
Returns True if at least one item in the list matches the comparison condition.
Inputs
ARRAY (Array), VAL (Any) - Comparison value *(the comparison operator is configured in the inspector)*.
Outputs
Q (Boolean) - True if any match.
Settings
• Operator: Comparison operator dropdown (==, !=, >, >=, <, <=, contains). • Value: Comparison target value (optional default if not wired).
All Match
Property
Details
Description
Returns True only if every single item in the list matches the comparison condition.
Inputs
ARRAY (Array), VAL (Any) - Comparison value *(the comparison operator is configured in the inspector)*.
Outputs
Q (Boolean) - True if all match.
Settings
• Operator: Comparison operator dropdown (==, !=, >, >=, <, <=, contains). • Value: Comparison target value (optional default if not wired).
Array Contains
Property
Details
Description
Checks if a specific target value exists anywhere within the list.
Inputs
ARRAY (Array), VALUE (Any) - Target value.
Outputs
RESULT (Boolean) - True if found.
Settings
Value: Target search value (optional default if not wired).
Array Index
Property
Details
Description
Finds the 0-based index of a value in the list (-1 if not found).
Inputs
ARRAY (Array), VALUE (Any)
Outputs
INDEX (Integer) - 0-based position (-1 if not found) FOUND (Boolean) - True if found.
Settings
Value: Target search value (optional default if not wired).
Array Length
Property
Details
Description
Returns total number of items in the provided list.
Inputs
ARRAY (Array)
Outputs
LEN (Integer) - Total count.
Settings
None
Is Empty
Property
Details
Description
Returns True if the array contains zero items.
Inputs
ARRAY (Array)
Outputs
RESULT (Boolean) - True if empty.
Settings
None
Get Item
Property
Details
Description
Retrieves a specific item from a list by its 0-based index.
Inputs
ARRAY (Array), INDEX (Integer - 0 is first)
Outputs
ITEM (Any) - Value at index.
Settings
Index: 0-based integer index to retrieve (optional default if not wired).
Average
Property
Details
Description
Calculates arithmetic mean (average) of all numeric items in the list.
Inputs
ARRAY (Numeric Array)
Outputs
RESULT (Double) - Mean average.
Settings
None
Sum
Property
Details
Description
Calculates total sum of all numeric items in the list.
Inputs
ARRAY (Numeric Array)
Outputs
RESULT (Double) - Total sum.
Settings
None
Minimum
Property
Details
Description
Finds the smallest value in the list.
Inputs
ARRAY (Numeric Array)
Outputs
RESULT (Double) - Lowest value.
Settings
None
Maximum
Property
Details
Description
Finds the largest value in the list.
Inputs
ARRAY (Numeric Array)
Outputs
RESULT (Double) - Highest value.
Settings
None
4.4.11 Collections & Object Extraction
Nodes designed for parsing structured, multi-property object records.
Collection Scope
Property
Details
Description
Iterates through items in a collection, setting local item scopes for each element. Displays dynamic canvas subtitle foreach [{Key}] (e.g. foreach [id]).
Filters a collection by comparing one field of each object against a value (Result is a new collection).
Inputs
COLLECTION (Any), VALUE (Any - compare value)
Outputs
RESULT (Filtered Collection)
Settings
• Field: Target property path inside object items to test. • Value: Comparison target value (optional default if not wired).
Collection Sort
Property
Details
Description
Sorts a collection by one or more field criteria in ascending (ASC) or descending (DESC) order.
Inputs
COLLECTION (Any)
Outputs
RESULT (Sorted Collection)
Settings
Sorting Criteria: Configurable list of target fields and sorting orders (ASC/DESC). Criteria fields are automatically deduplicated (case-insensitively) when saved or reloaded.
Collection First
Property
Details
Description
Extracts first object from collection (result is null if empty). Output NOT_NULL indicates if found.
Inputs
COLLECTION (Any)
Outputs
RESULT (Any) - First object payload NOT_NULL (Boolean) - True if item was found.
Settings
None
Object Get
Property
Details
Description
Reads a specific field value from a single object. When connected to upstream nodes (e.g. JSON Deserialize or Collection Scope), ports and available field schemas are dynamically updated and refreshed upon wiring.
Inputs
OBJECT (Any)
Outputs
RESULT (Any) - Extracted field value.
Settings
Field: Target property path to extract (e.g., payload.temperature). Automatically populates suggestions or field options based on connected upstream schemas.
Collection Any
Property
Details
Description
Returns True if at least one object in collection matches selected field/operator/value condition.
Inputs
COLLECTION (Any), VALUE (Any)
Outputs
RESULT (Boolean) - True if any match.
Settings
• Field: Property path tested across items. • Value: Comparison target value (optional default if not wired).
Collection All
Property
Details
Description
Returns True only if every object in collection matches selected field/operator/value condition.
Inputs
COLLECTION (Any), VALUE (Any)
Outputs
RESULT (Boolean) - True if all match.
Settings
• Field: Property path tested across items. • Value: Comparison target value (optional default if not wired).
Collection Count
Property
Details
Description
Counts how many items are currently in the input collection.
Inputs
COLLECTION (Any)
Outputs
COUNT (Integer) - Total number of objects.
Settings
None
Collection Select
Property
Details
Description
Projects one or more fields from each object in a collection into a new collection (or array when a single primitive field is selected).
Inputs
COLLECTION (Any)
Outputs
RESULT (Collection) - Projected collection output with synthesized field schema (or Array if single field).
Settings
• Fields: Multi-field projection editor managed via + Add Field and remove buttons for projecting multiple properties into new objects. • Field (Single): Single property path for backward-compatible scalar projections. • Schema Propagation: Downstream nodes automatically inherit the synthesized schema of projected fields.
4.4.12 JSON Utilities
Nodes for parsing, validating, building, and extracting values from JSON payloads.
Deserialize
Property
Details
Description
Parses a raw JSON string into a structured object schema for field extraction.
Inputs
JSON (String)
Outputs
SUCCESS (Boolean). Dynamic output ports generated for parsed object properties.
Parses a JSON array string into an enumerable metadata-backed collection.
Inputs
JSON (String)
Outputs
COLLECTION (Any) - Parsed collection output.
Settings
Schema: Item schema definition.
Extract
Property
Details
Description
Retrieves one or more fields from a JSON string using JSONPath or dot-notation paths. Automatically validates incoming JSON syntax and verifies that all configured paths exist with non-null values. Displays dynamic subtitle N fields (e.g. 3 fields) on the canvas header.
• SUCCESS (Boolean) - Emits True when the input payload is valid JSON and all configured extraction paths exist with non-null values. Emits False when JSON parsing fails, the input is null/empty, or any configured path is missing or null. • Dynamic Field Outputs - Dedicated output ports generated for each configured extraction field (field:0, field:1, etc.), emitting the extracted value converted to the selected data type.
Settings
Fields: Dynamic list of field extraction definitions managed via + Add Field: • Name: Display label for the generated output port. • Path: JSONPath expression or dot-notation path (e.g., $.objects, header.seq, items[0].temperature). • Type: Target data type conversion (String, Int, Double, Bool, DateTime).
Is Valid
Property
Details
Description
Validates that a string is a correctly formatted JSON object.
Inputs
JSON (String)
Outputs
Q (Boolean) - True if valid JSON.
Settings
None
4.4.13 DateTime
Nodes for parsing, manipulating, and comparing timestamps and date/time objects.
Parse Date
Property
Details
Description
Parses a date/time string or numeric timestamp into a structured DateTime and Unix timestamps.
Inputs
INPUT (String or Double) - Source date string or numeric timestamp depending on selected input type.
Outputs
• SUCCESS (Boolean) - True if parsing succeeded (positioned at top). • DT (DateTime) - Parsed DateTime string formatted as yyyy-MM-dd HH:mm:ss. • UNIX_S (Double) - Unix timestamp in seconds. • UNIX_MS (Double) - Unix timestamp in milliseconds.
Settings
• Input Type: Dropdown selecting String or Double. Dynamic input port type adjusts automatically. • Pattern: *(When Input Type is String)* Optional custom date format pattern (e.g. yyyy/MM/dd). • Format: *(When Input Type is Double)* Dropdown selecting timestamp format: OLE Automation Date, Unix Timestamp (s), or Unix Timestamp (ms). • Input: Direct value editor to provide an input value without wiring.
Date Diff
Property
Details
Description
Calculates the elapsed time duration difference between two DateTime points (A - B).
Inputs
A (DateTime) - First DateTime B (DateTime) - Second DateTime.
Outputs
DAYS (Double), HOURS (Double), MINUTES (Double), SECONDS (Double), MILLISECONDS (Double)
Settings
None
Date Add
Property
Details
Description
Adds a specific numeric duration interval to a DateTime value.
Inputs
DT (DateTime) - DateTime input VALUE (Integer) - Duration to add.
Outputs
RESULT (DateTime) - Resulting DateTime object.
Settings
Interval: Time unit (Days, Hours, Minutes, Seconds).
Date Equal
Property
Details
Description
Compares two DateTime values for exact timestamp equality.
Inputs
A (DateTime), B (DateTime)
Outputs
RESULT (Boolean) - True if equal.
Settings
None
4.4.14 Bitwise
Low-level masking and bit manipulation for PLC holding registers.
Explode
Property
Details
Description
Breaks a numeric bitmask into individual boolean status signals (16, 32, or 64 bit).
Inputs
VALUE (Number) - Source bitmask value.
Outputs
BIT 0, BIT 1... BIT 15 (Boolean) - Individual bit status outputs.
Settings
Bits: Number of bits to output (default 16).
Pack
Property
Details
Description
Combines multiple boolean signals into a single numeric bitmask (16, 32, or 64 bit).
Inputs
BIT 0, BIT 1... BIT 15 (Boolean)
Outputs
RESULT (Number) - Packed bitmask value.
Settings
Bits: Number of bits to pack (default 16).
Test
Property
Details
Description
Checks if a specific bit index (0-63) is set in the input numeric value.
Inputs
VALUE (Number) - Integer source INDEX (Integer) - Bit position.
Outputs
RESULT (Boolean) - True if bit is 1.
Settings
None
AND
Property
Details
Description
Computes the bitwise AND of two numeric integer values.
Inputs
LEFT (Number), RIGHT (Number)
Outputs
RESULT (Number) - Bitwise AND product.
Settings
None
OR
Property
Details
Description
Computes the bitwise OR of two numeric integer values.
Inputs
LEFT (Number), RIGHT (Number)
Outputs
RESULT (Number) - Bitwise OR sum.
Settings
None
XOR
Property
Details
Description
Computes the bitwise XOR of two numeric integer values.
Inputs
LEFT (Number), RIGHT (Number)
Outputs
RESULT (Number) - Bitwise XOR sum.
Settings
None
NOT
Property
Details
Description
Inverts all bits of the input numeric integer value.
Inputs
INPUT (Number) - Integer source.
Outputs
RESULT (Number) - Inverted bits result.
Settings
None
Shift Left
Property
Details
Description
Shifts bits of input value left by specified positions.
Inputs
LEFT (Number) - Source value RIGHT (Integer) - Shift amount.
Outputs
RESULT (Number) - Shifted result.
Settings
None
Shift Right
Property
Details
Description
Shifts bits of input value right by specified positions.
Inputs
LEFT (Number) - Source value RIGHT (Integer) - Shift amount.
Outputs
RESULT (Number) - Shifted result.
Settings
None
4.4.15 Cryptography
Security-focused nodes for data encryption and integrity verification.
AES
Property
Details
Description
AES symmetric encryption/decryption. Encryption returns Base64 payload containing salt and IV.
Inputs
TEXT (String) - Plaintext or Base64 payload KEY (String) - Password / shared secret.
Outputs
RESULT (String) - Encrypted or decrypted text.
Settings
Mode: encrypt or decrypt.
RSA
Property
Details
Description
RSA asymmetric encryption/decryption accepting PEM or XML keys using OAEP-SHA256.
Inputs
TEXT (String) - Plaintext or Base64 payload KEY (String) - PEM or XML RSA key.
Outputs
RESULT (String) - Encrypted or decrypted text.
Settings
Mode: encrypt or decrypt.
SHA-2
Property
Details
Description
Computes SHA-2 digest (256 or 512 variant). Output is lowercase hexadecimal.
Inputs
TEXT (String) - Input text payload.
Outputs
RESULT (String) - Lowercase hex digest.
Settings
Variant: 256 (SHA-256) or 512 (SHA-512).
MD5
Property
Details
Description
Computes MD5 checksum digest of input text and returns lowercase hexadecimal.
Inputs
TEXT (String) - Input text payload.
Outputs
RESULT (String) - Lowercase hex digest.
Settings
None
4.4.16 Tools
File I/O and data conversion utility action nodes.
Read File
Property
Details
Description
Reads file content from local disk or network path.
Uniflow supports multiple source adapters. Each adapter requires specific configuration parameters to successfully initialize network bindings, establish communication handshakes, and ingest field data.
5.1 Built-In System Sources
In addition to external source adapters, Uniflow features two foundational built-in sources available to trigger rule execution:
System Timer
A built-in interval clock that generates periodic execution impulses at a configured frequency (governed by the system setting HeartbeatIntervalMs, defaulting to 100ms / 10 Hz). It is deployed to drive scheduled workflows, watchdog heartbeats, or periodic polling tasks.
Internal Storage
A built-in source linked directly to Uniflow's internal memory registry. Whenever a targeted storage variable changes state, it instantly awakens bound rule graphs, allowing engineers to chain multi-stage calculation pipelines seamlessly.
5.2 Sources "Data Points" vs. Event/Direct Data Ingestion
While many source adapters sample multi-variable data tables via Data Points, others operate without Data Points and instead inject data directly through event triggers or exposed data payloads (collections or scalar values).
Data Points Ingestion: Used by adapters that map specific, addressable memory registers or variables within an external device (e.g., Modbus registers, OPC UA nodes, SNMP OIDs, BACnet objects). Uniflow either continuously polls these data points at configured intervals or subscribes to value changes. Incoming bytes are unpacked, converted to strongly typed values (Integers, Doubles, Booleans, Strings), and cached for evaluation.
Configuring Data Points: In adapter settings with point tables, click Add Point (+) to define Point ID / Name, Address / Register, Data Type, and Access permissions.
Event & Direct Data Ingestion (No Data Points): Many adapters do not require configuring individual Data Points. Instead, they interact with Rule Graphs through:
Event Inputs: Pushing real-time event triggers and structured payloads directly into visual rule graphs (e.g., VMS motion/analytic alerts, SIA receiver alarm codes, Lidar spatial intrusion events).
Directly Exposed Data: Exposing raw scalar values, JSON strings, or collection objects directly across the graph node interface (e.g., incoming MQTT topic payloads, HTTP REST response bodies, raw serial line buffers).
5.3 Internal & System Classifications
5.3.1 System Timer
NOTE
Scope & Common Use Case
Deployed as an internal execution clock. Commonly used in automated facilities to trigger scheduled maintenance scripts, poll web endpoints at precise intervals, or heartbeat system storage points.
PollIntervalMs (Integer | [Required] | Default: 1000): The precise time interval in milliseconds between execution pulse ticks.
Used to chain complex workflows. Commonly deployed when Rule A calculates an industrial KPI and writes it to memory, instantly triggering Rule B to evaluate threshold alarms against that new KPI value.
PointId (String | [Required] | Default: ""): The exact storage tag identifier or memory address key to monitor.
Rule Graph Node Interface:
InputSource: Value (Any) - Fires execution on any memory variable changes, emitting the new state.
DataSource: Value (Any) - Returns the current cached memory state on demand.
EventInput: Not supported.
OutputTarget: Value (Any) - Updates the internal memory register with the incoming target value.
5.3.3 System Alerts
NOTE
Scope & Common Use Case
Deployed as an internal alert target. Commonly used when Rule logic detects abnormal operational conditions (such as threshold breaches, device connectivity faults, or physical security events) and needs to raise system-wide alerts on the Dashboard/Topology view and optionally dispatch automated SMTP email notifications.
Level (Dropdown / String | [Required] | Options: Warning, Info, Critical): The severity level assigned to the generated alert.
Message (String | [Required] | Default: ""): Human-readable alert notification text describing the specific event or state.
Rule Graph Node Interface:
InputSource: Not supported.
DataSource: Not supported.
EventInput: Not supported.
OutputTarget:
Trigger (Boolean) - Pulse input to initiate alert generation.
Detailed configuration parameters, protocol specifications, and operational workflows for external source adapters (such as Modbus, OPC UA, CAN Bus, MQTT, SNMP, HTTP, Serial Port, Email, BACnet, Avigilon, Milestone, Hexagon Lidar, SIA, KisanCM, etc.) are maintained in their respective dedicated plugin reference manuals.
6. Advanced Features & Troubleshooting
6.1 Diagnostic Inspection & Error Tracing
When a visual rule fails or an adapter reports a fault:
Step 1. Navigate to the Logs view.
Step 2. Ensure the Level Filter is set to Error or Warning to isolate the problem.
Step 3. Locate the error entry and double-click the row to view the complete multi-line stack trace.
Step 4. For source adapters, switch to the Sources view and observe the Runtime Status error sub-label, which provides immediate driver-level feedback (e.g., *Socket Timeout*, *Authentication Refused*, *Register Out of Bounds*).
When a rule triggered by high-frequency telemetry (InputSource) attempts to execute actions that take longer to resolve than the incoming trigger interval, the rule enters Backpressure Skip State.
6.2.1 Understanding Backpressure Alerts
When executions are dropped, Uniflow raises a system warning alert in the Alerts Panel and logs a diagnostic message:
Alert Message: Rule '{RuleName}' is skipping executions due to backpressure.
Enriched Detail: Rule execution dropped because previous execution is still running. Currently executing action '{ActionName}' targeting '{TargetSourceName}' (running for Xs).
Alert Debouncing: To prevent alarm fatigue and log saturation during continuous data floods, Uniflow uses state-transition alerting. An alert is raised when the rule transitions into skip state. The rule must experience at least 5 seconds of continuous healthy operation (zero dropped executions) before it clears the skip state and can trigger a new alert.
6.2.2 Diagnosing the Root Cause
Inspect the Alert Detail: The alert detail immediately identifies the exact bottleneck:
Action Name: Which specific action node is actively executing (e.g., Save Snapshot to Folder vs. Insert Database Record).
Target Source: Which external system or adapter is holding execution (e.g., Camera vs. Postgres).
Duration: How long that specific action has been running (e.g., running for 2.3s).
Examine Live Rule Runtime Preview:
In the Rules table, click the Preview button ([P]) on the affected rule.
Look for nodes glowing Deep Blue (indicating an active asynchronous task or external I/O wait).
Trace nodes highlighted in Amber to observe skipped branches.
Review millisecond-precise timestamps in the integrated diagnostic terminal to quantify latency across individual nodes.
6.2.3 Common Root Causes of Bottlenecks
Physical Device & Network Protocol Sinks: Hardware actions (such as ONVIF camera snapshot downloads, SOAP operations, PTZ movements, slow serial/TCP endpoints, or remote HTTP webhooks) typically take between 300 ms and 3,000 ms to complete. If an upstream sensor (such as Lidar MQTT) produces updates every 50 ms, 10–20 incoming triggers will be dropped every time a physical action is invoked.
Synchronous Database Operations: High-frequency INSERT or UPDATE actions executing directly against relational databases without write batching can hit connection pool limits or disk I/O contention.
Sequential Action Blocking: Because actions within a rule execute sequentially, placing a fast action (e.g., database logging) after a slow action (e.g., camera capture) means the fast action is delayed or dropped whenever the slow action holds the lock.
To eliminate backpressure drops and ensure reliable operation under high load, apply these design best practices:
Pattern 1: Rule Splitting (Decouple Fast Sinks from Slow Hardware Sinks)
*Problem*: A single rule takes a camera picture (slow) and logs metadata to a database (fast). When the camera is busy, database records are lost.
*Solution*: Split the logic into two separate rules triggered by the same input source:
Rule A: Database Logger (Priority = 80): Evaluates the condition and writes immediately to the database. Completes in 1–5 ms. Holds the gate for mere milliseconds and never drops triggers.
Rule B: Camera Snapshot (Priority = 50): Evaluates the condition and commands the camera. Takes 1,000 ms. Safely drops redundant snapshot triggers during bursts without affecting the database.
Pattern 2: Choose EventInput for Zero-Drop Event Queuing
If every single incoming message must be evaluated and recorded without skipping (e.g., discrete transactional records, file ingest, access control events), configure the trigger using an EventInput node rather than an InputSource node. Event inputs automatically queue executions rather than dropping them.
Pattern 3: Action Cooldown & Trigger Debouncing
In the outbound action node's property panel, set a Cooldown (ms) (e.g., 2,000 ms) or Debounce (ms). This ensures that physical devices (such as PTZ motors or cameras) are not commanded at a rate exceeding their hardware capabilities.
Pattern 4: Optimize Write Policies
Change the action Write Policy from Always to OnChange or OnChangeWithTolerance. If incoming values have not changed, the write is skipped instantly in memory without initiating an external network call to the target adapter.
Pattern 5: Enable Decoupled Write Batching for Databases
For database sinks using the DBLink adapter, ensure Write Batching & Backpressure Mitigation is enabled in the source editor. Inbound writes are queued in-memory and committed in cohesive background batches (at 5 flushes/sec) over a pooled connection, completely eliminating rule backpressure drops.
6.3 Licensing Limits & Subsystem Verification
If new source adapters fail to start:
Step 1. Navigate to Settings → License.
Step 2. Inspect the Status Badge Card to ensure the system is not reporting *UNLICENSED SYSTEM* or *LICENSE EXPIRED*.
Step 3. Review the Allowed Capacity Limits Table to verify that your active source counts do not exceed the permitted connection thresholds for that specific SourceType.

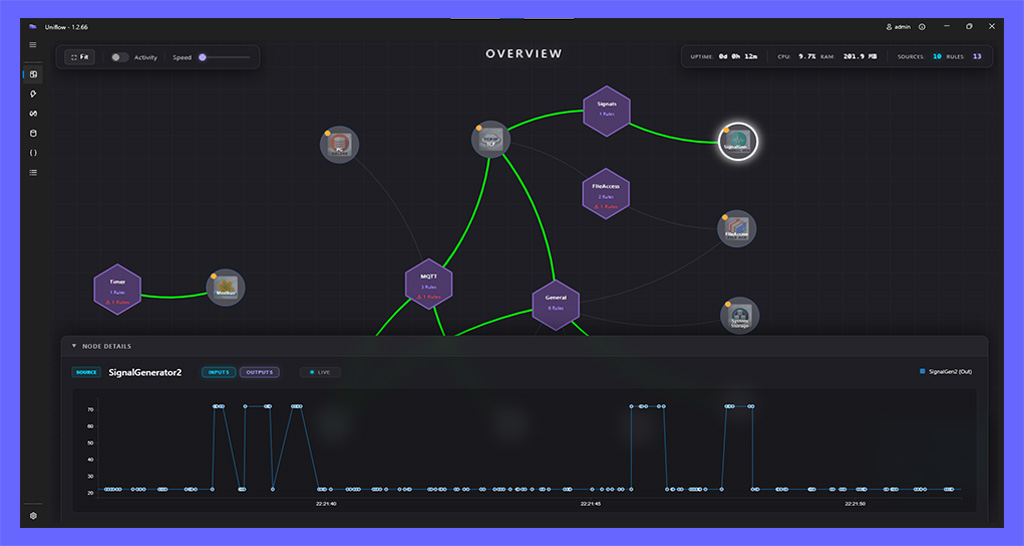
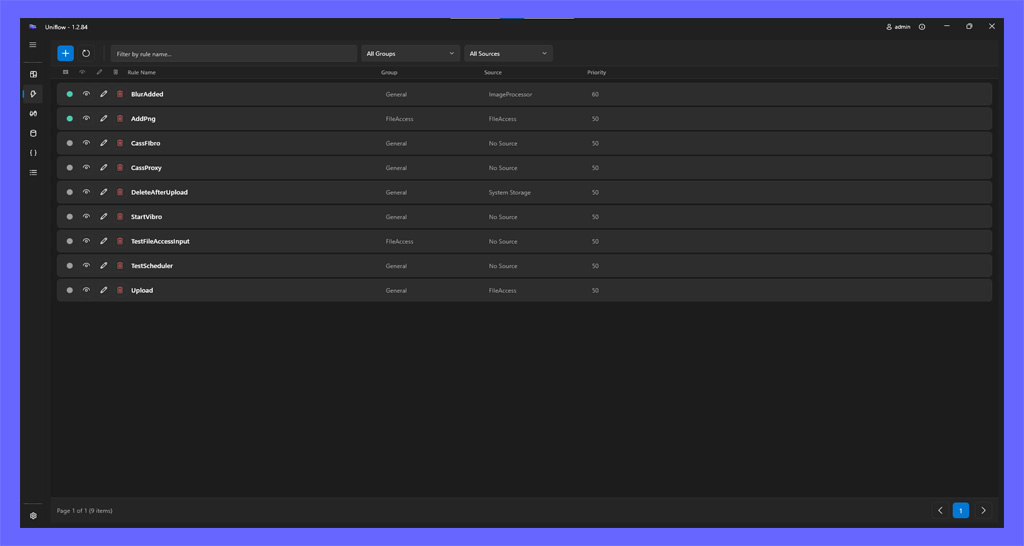
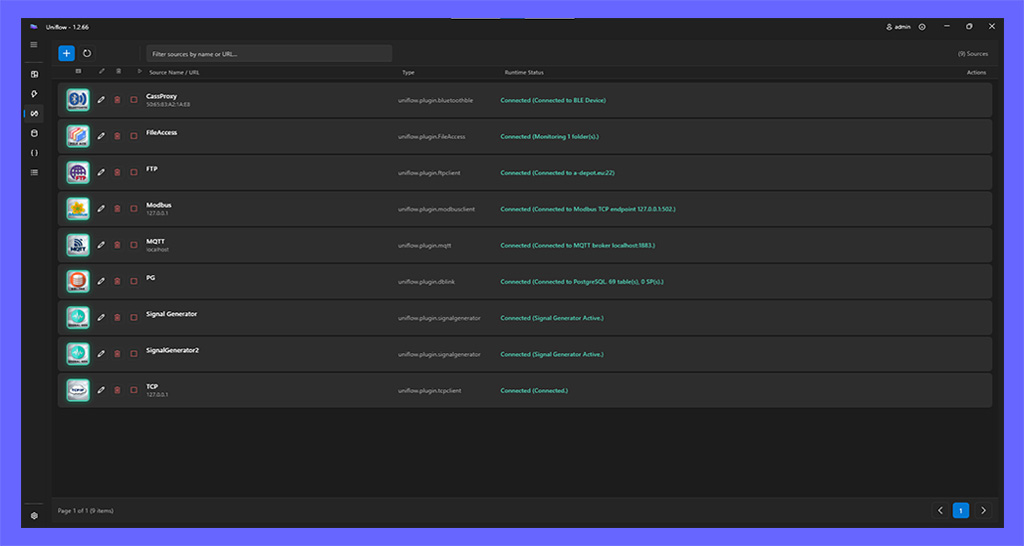
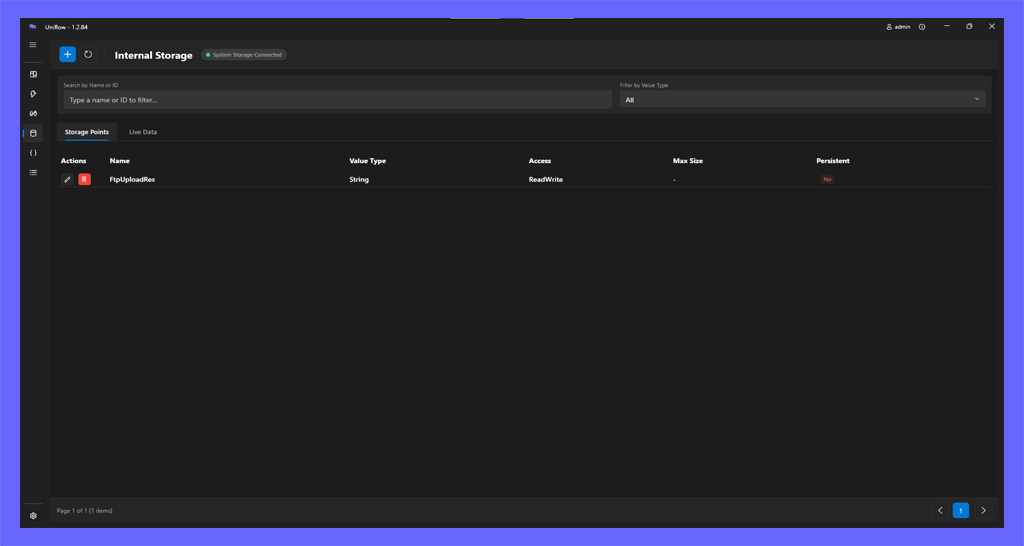
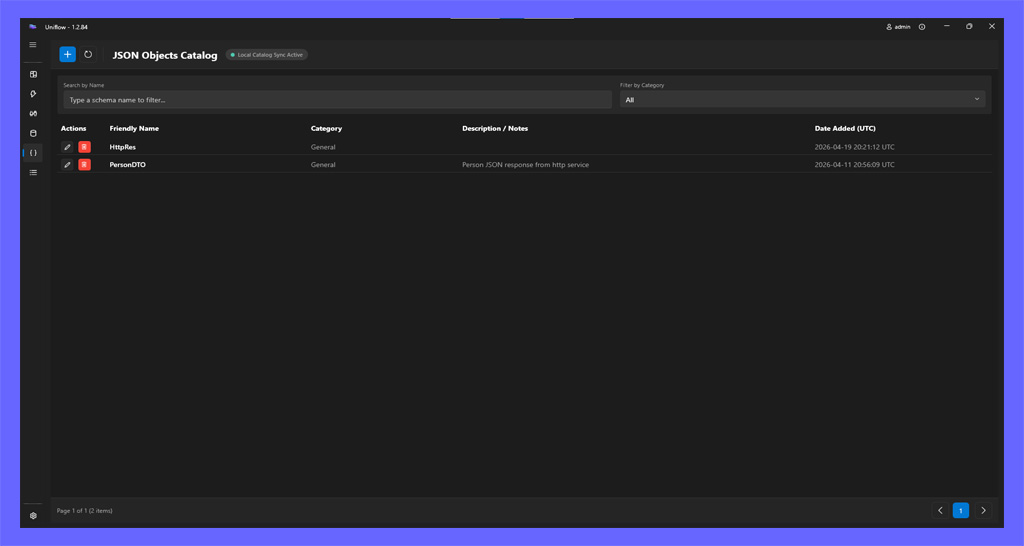
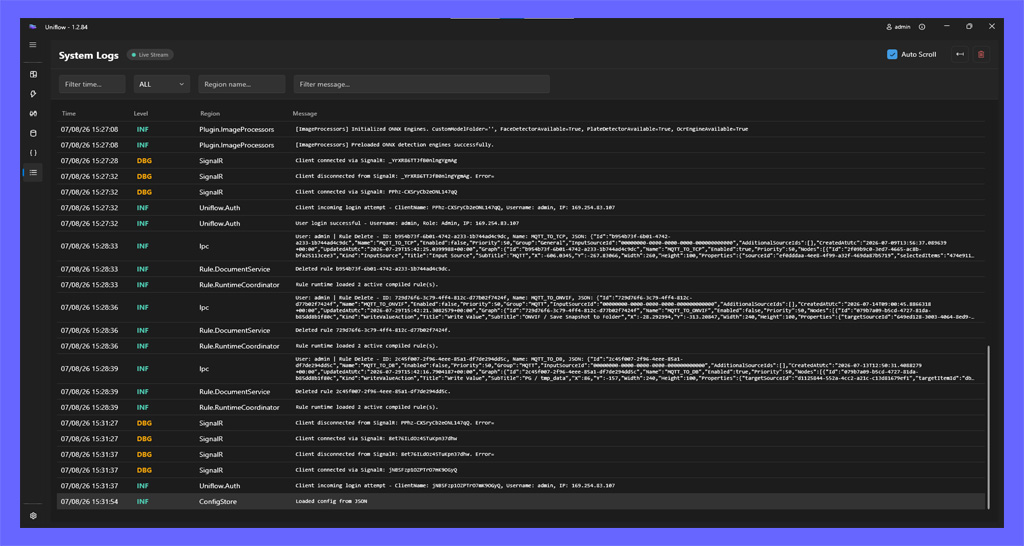
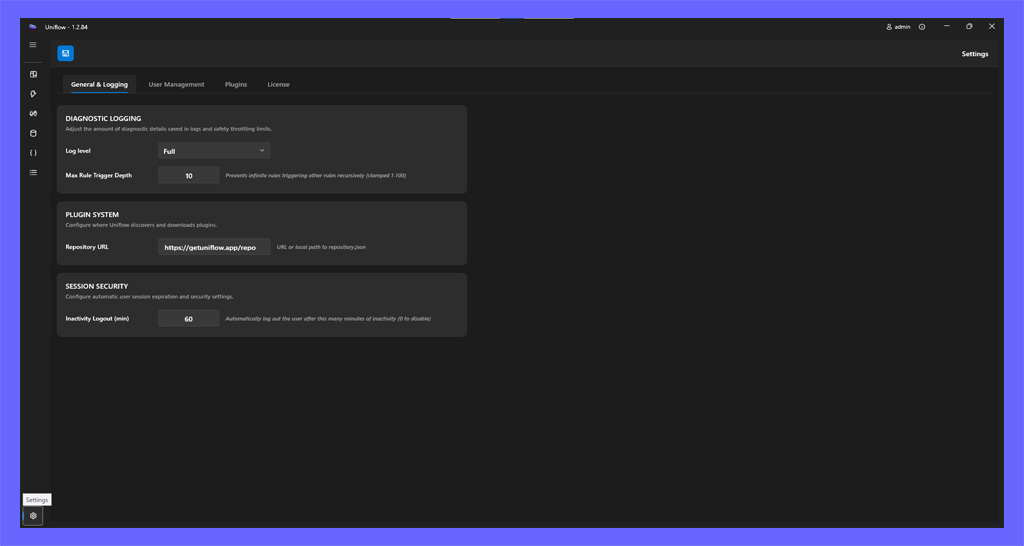
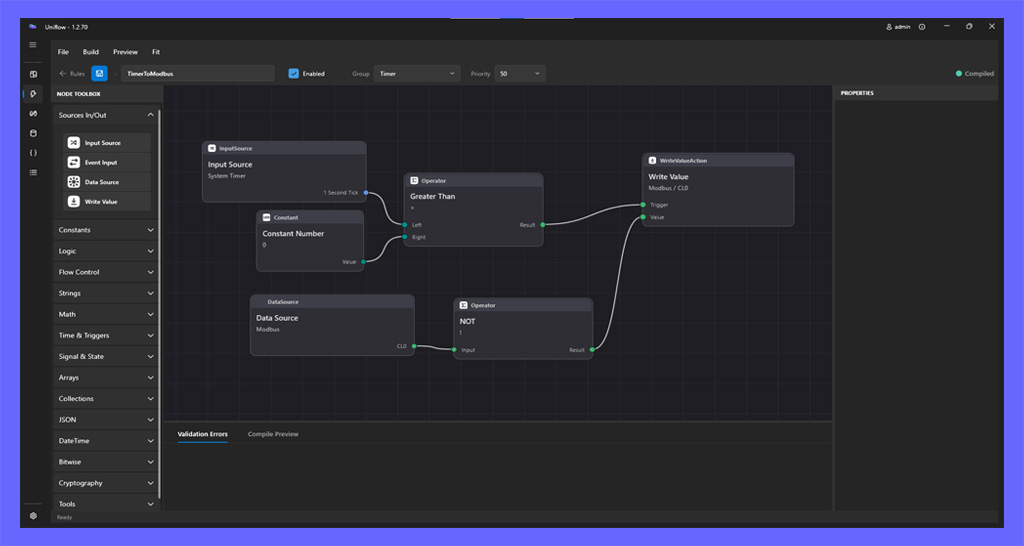
 Input Source
 Event Input
 Data Source
 Output Target
 Constant Number
 Constant Boolean
 Constant String
 Constant Array
 Vector
 Current Time
 Guid
Guid Greater Than
 Greater Than or Equal
 Less Than
 Less Than or Equal
 Equal
Equal Not Equal
 Logical AND
 Logical OR
 Logical XOR
 Is NULL
 Default Value (Coalesce)
 Branch (If / Else)
 Switch
 Addition
 Subtraction
 Multiplication
 Division
 Square Root
 Power
Power Logarithm
 Sine
Sine Cosine
 Tangent
 Random
 Abs
Abs Pulse (TP)
 Timer On-Delay (TON)
 Rising Edge (R_TRIG)
 Linear Scaling
 Moving Average (Smoothing)
 Hysteresis Filter
 SR Flip-Flop
 Count Up (CTU)
 Count Down (CTD)
 Count Up/Down (CTUD)
 String Split
 Array Scope
 Collection Filter
 Collection First
 Object Get
 Collection Select
 Deserialize
 Explode
 AES
AES